What, Why and How
Visual Analytics Framework
John Alexis Guerra Gómez| ja.guerrag[at]uniandes.edu.co| @duto_guerra
http://johnguerra.co/lectures/visualAnalytics_24hours/02_What_Why_How/
Based onslides from Tamara Munzner
Idioms
Distinct approach to creating or manipulating visual representations
Idiom design space
The design space of possible vis idioms is huge, and includes the considerations of both how to create and how to interact with visual representations
Idioms
- How to draw it: visual encoding idiom
- Many possibilities for how to create
- How to manipulate it: interaction idiom
- Even more possibilities
- Make single idiom dynamic
- Link multiple idioms together through interaction
Why focus in tasks and effectiveness?
Computer-based visualization systems provide visual representations of datasets designed to help people carry out tasks more effectively.
Why focus in tasks and effectiveness?
- Tasks serve as constraint on design (as does data)
- Idioms do not serve all tasks equally!
- Challenge: recast tasks from domain-specific vocabulary to abstract forms
- Most possibilities ineffective
- Validation is necessary, but tricky
- Increases chance of finding good solutions if you understand full space of possibilities
Why focus in tasks and effectiveness?
- What counts as effective?
- novel: enable entirely new kinds of analysis
- faster: speed up existing workflows
Resource limitations
Vis designers must take into account three very different kinds of resource limitations: those of computers, of humans, and of displays.
Computational limits
- Processing time
- System memory
Human limits
- Human attention
- Memory
- Retention
Display limits
- Pixels are precious resource, the most constrained resource
- Information density: ratio of space used to encode info vs unused whitespace
- Tradeoff between clutter and wasting space, find sweet spot between dense and sparse
Visual Analytics Framework
Tables
- Attributes
- Items (rows)
Networks and Trees
- Items (nodes)
- Links
- Attributes
Fields
- Continuous
- Sampled
- e.g. Brain scan
Geometry
- Spatial
- 2D or 3D
- Inherent shape
Example
SpaceTree
http://www.cs.umd.edu/hcil/spacetree/SpaceTree
TreeJuxtaposer
https://www.cs.ubc.ca/~tmm/papers/tj/TreeJuxtaposer
Exercise
Let's find in how many ways we can visualize two numbers 13 and 23
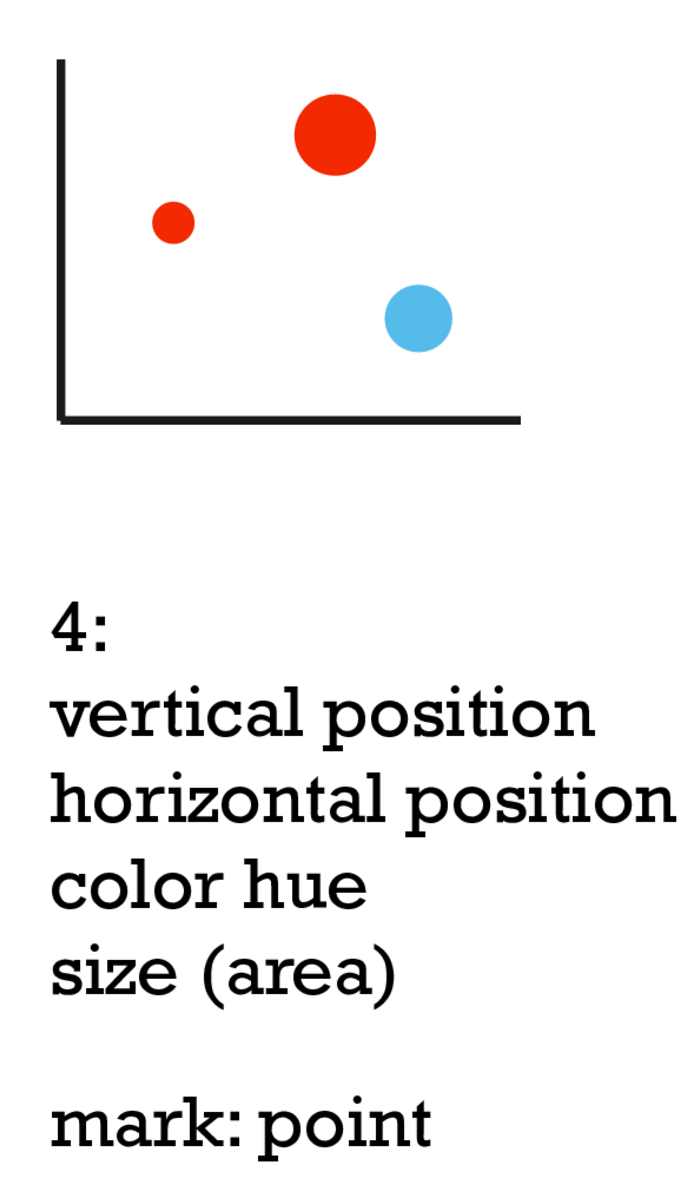
Marks and channels
What marks and channels?

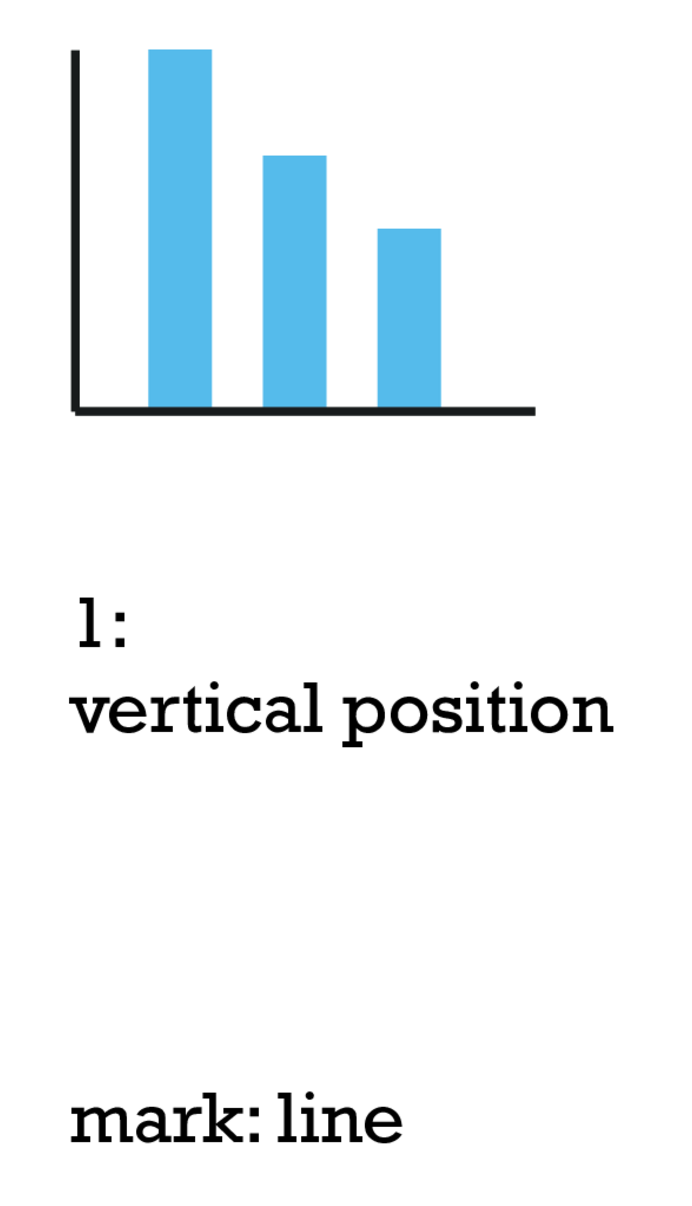
What marks and channels?

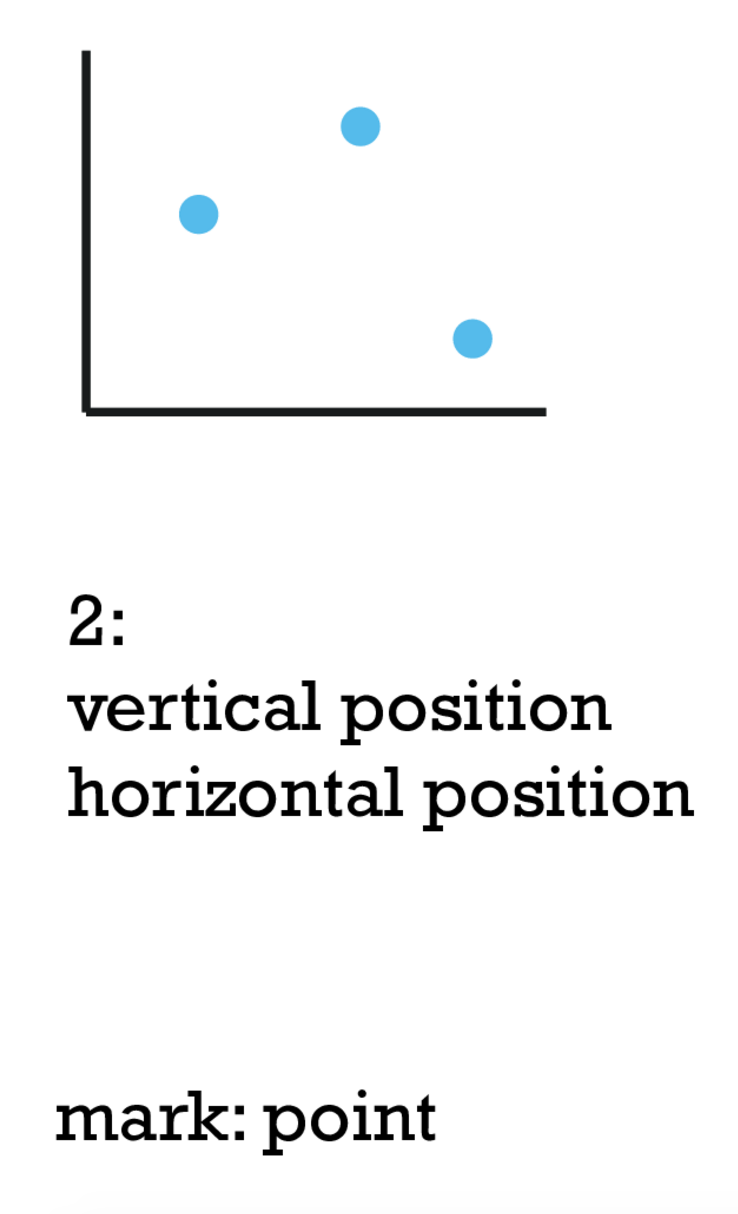
What marks and channels?

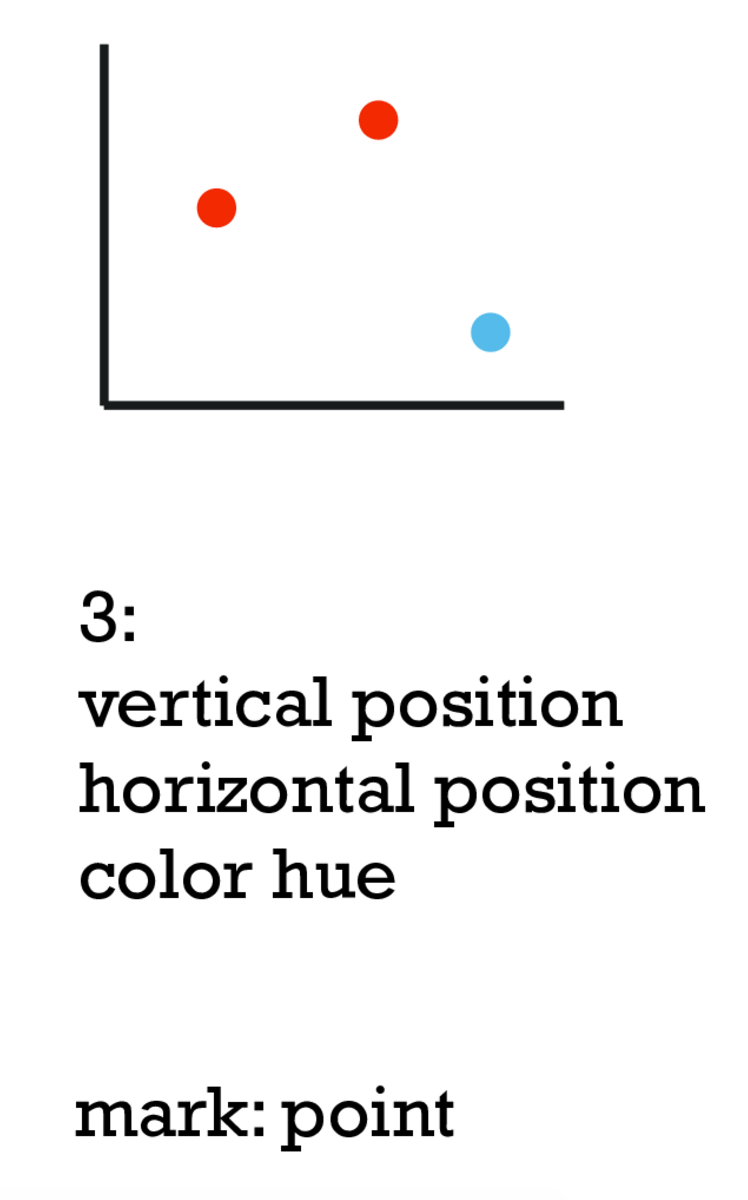
What marks and channels?

Effectiveness and Expressiveness
Expressiveness
- Visual encoding should express all of, and only, the information in the dataset
- Ordered data should be shown in a way we perceive as ordered
- Match channel and data characteristics
Effectiveness
Encode most important attributes with highest ranked channels
[Automating the Design of Graphical Presentations of Relational Information. Mackinlay. ACM Trans. on Graphics (TOG) 5:2 (1986), 110–141]
Where does the ranking come from?
- Accuracy
- Discriminability
- Separability
- Popout