ISIS 4822 : Visual Analytics
John Alexis Guerra Gómez| ja.guerrag[at]uniandes.edu.co| @duto_guerra
Jose Tiberio Hernandez | jhernand[at]uniandes.edu.co
Universidad de los Andes
http://johnguerra.co/lectures/visualAnalytics_fall2016/01_Introduction/
Based onslides from Tamara Munzner
Syllabus
Book
Visualization Analysis and Design, Tamara Munzner

Projects & Homeworks
- Design critique
- Individual mid class project
- Group final project (3 people), 25% of the grade
Introduction
Definitions
Defining Visualization (vis)
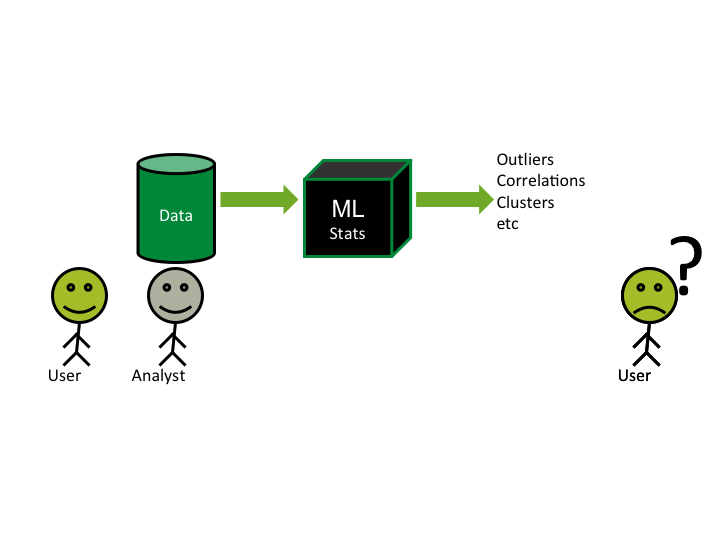
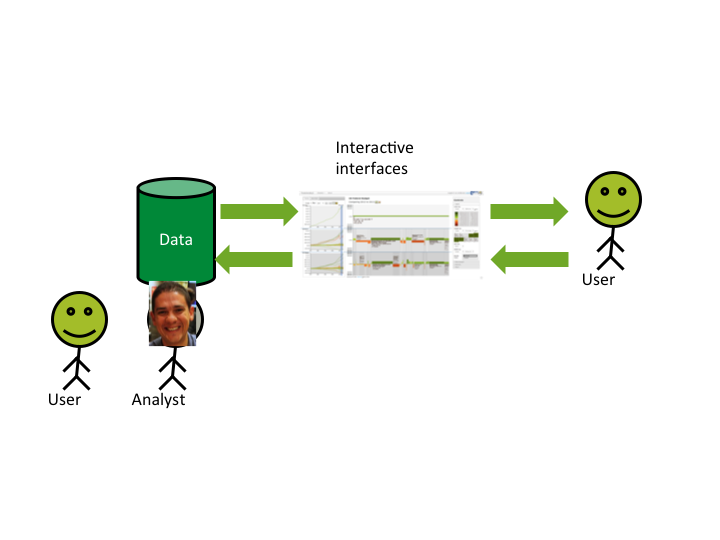
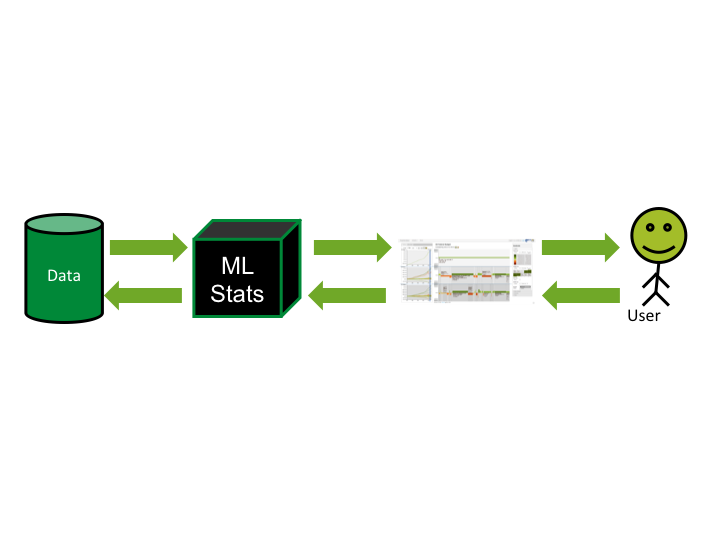
Computer-based visualization systems provide visual representations of datasets designed to help people carry out tasks more effectively.
Why?
Have the human in the loop
Visualization is suitable when there is a need to augment human capabilities rather than replace people with computational decision-making methods.
When don't use vis?
Don’t need vis when fully automatic solution exists and is trusted
But
- Many analysis problems are ill-specified
- Don’t know exactly what questions to ask in advance
Vis allows for
- Long-term use for end users (e.g. exploratory analysis of scientific data)
- Presentation of known results
- Stepping stone to better understanding of requirements before developing models
- Help developers of automatic solution refine/debug, determine parameters
- Help end users of automatic solutions verify, build trust
Why use an external representation?
Computer-based visualization systems provide visual representations of datasets designed to help people carry out tasks more effectively.
Why use an external representation?
External representation: replace cognition with perception
[Cerebral: Visualizing Multiple Experimental Conditions on a Graph with Biological Context. Barsky, Munzner, Gardy, and Kincaid. IEEE TVCG (Proc. InfoVis) 14(6):1253-1260, 2008.]
Why use computer in the loop?
Computer-based visualization systems provide visual representations of datasets designed to help people carry out tasks more effectively.
Why have a computer in the loop?
- Beyond human patience
- Scale to large datasets
- Support interactivity
Why depend on vision?
Computer-based visualization systems provide visual representations of datasets designed to help people carry out tasks more effectively.
Why depend on vision?
- Human visual system is high-bandwidth channel to brain
- Overview possible due to background processing
- Subjective experience of seeing everything simultaneously
- Significant processing occurs in parallel and pre-attentively
- sound: lower bandwidth and different semantics
- overview not supported
- subjective experience of sequential stream
- touch/haptics: impoverished record/replay capacity
- only very low-bandwidth communication thus far
- taste, smell: no viable record/replay devices
Why show data in detail?
- Summaries lose information
- Confirm expected and find unexpected patterns
- Assess validity of statistical model
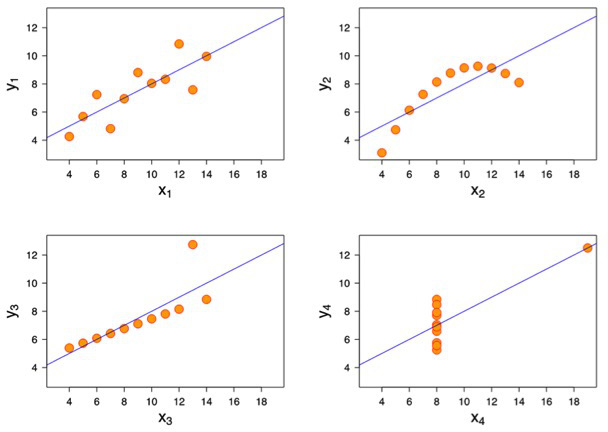
The power of your eyes: Anscombe's quartet
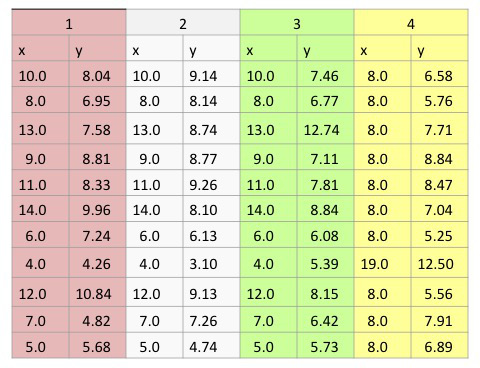
Anscombe's quartet
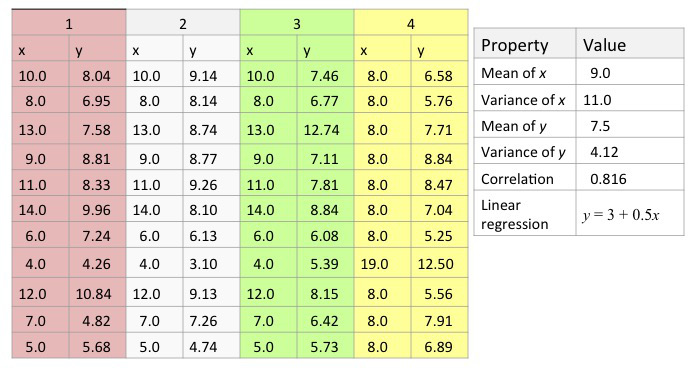
Anscombe's visualized
Idioms
Distinct approach to creating or manipulating visual representations
Exercise
Let's find in how many ways we can visualize two numbers 13 and 23
Idiom design space
The design space of possible vis idioms is huge, and includes the considerations of both how to create and how to interact with visual representations
Idioms
- How to draw it: visual encoding idiom
- Many possibilities for how to create
- How to manipulate it: interaction idiom
- Even more possibilities
- Make single idiom dynamic
- Link multiple idioms together through interaction
Why focus in tasks and effectiveness?
Computer-based visualization systems provide visual representations of datasets designed to help people carry out tasks more effectively.
Why focus in tasks and effectiveness?
- Tasks serve as constraint on design (as does data)
- Idioms do not serve all tasks equally!
- Challenge: recast tasks from domain-specific vocabulary to abstract forms
- Most possibilities ineffective
- Validation is necessary, but tricky
- Increases chance of finding good solutions if you understand full space of possibilities
What counts as effective?
- Novel: enable entirely new kinds of analysis
- Faster: speed up existing workflows
Resource limitations
Vis designers must take into account three very different kinds of resource limitations: those of computers, of humans, and of displays.
Computational limits
- Processing time
- System memory
Human limits
- Human attention
- Memory
- Retention
Display limits
- Pixels are precious resource, the most constrained resource
- Information density: ratio of space used to encode info vs unused whitespace
- Tradeoff between clutter and wasting space, find sweet spot between dense and sparse
Visual Analytics
How to do data analytics?
- Statistical Analysis
- Machine Learning and Artificial Intelligence
- Visual Analytics (and data analytics)
Data Mining/Machine Learning
Information Visualization
Visual Analytics
Traditional
Pros:
Cons:
|
Data Mining/ML
Pros:
Cons:
|
InfoVis
Pros:
Cons
|
In Infovis we look for insights
- Deep understanding
- Meaningful
- Non obvious
- Actionable
Insights
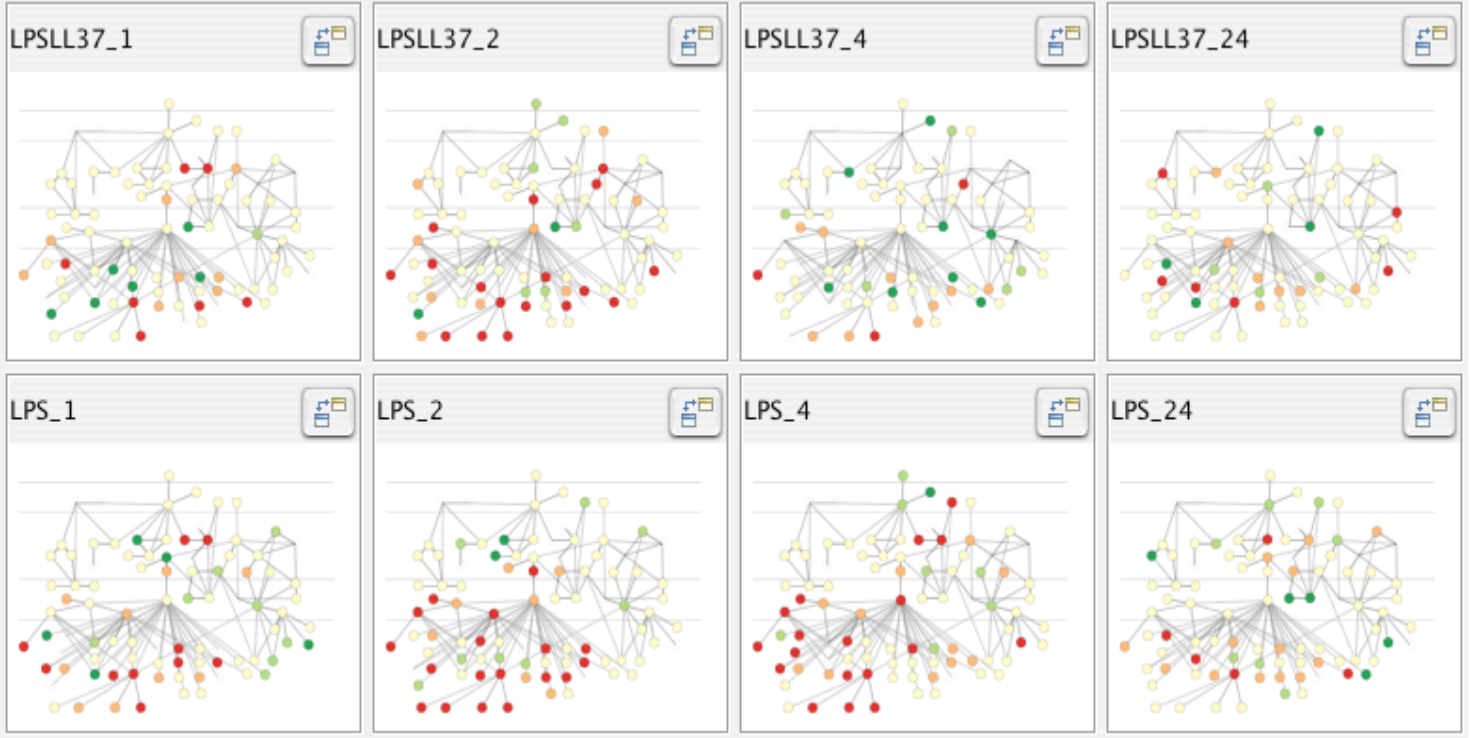
FDA
Task: Change in drug's adverse effects reports
User: FDA Analysts
State of the art
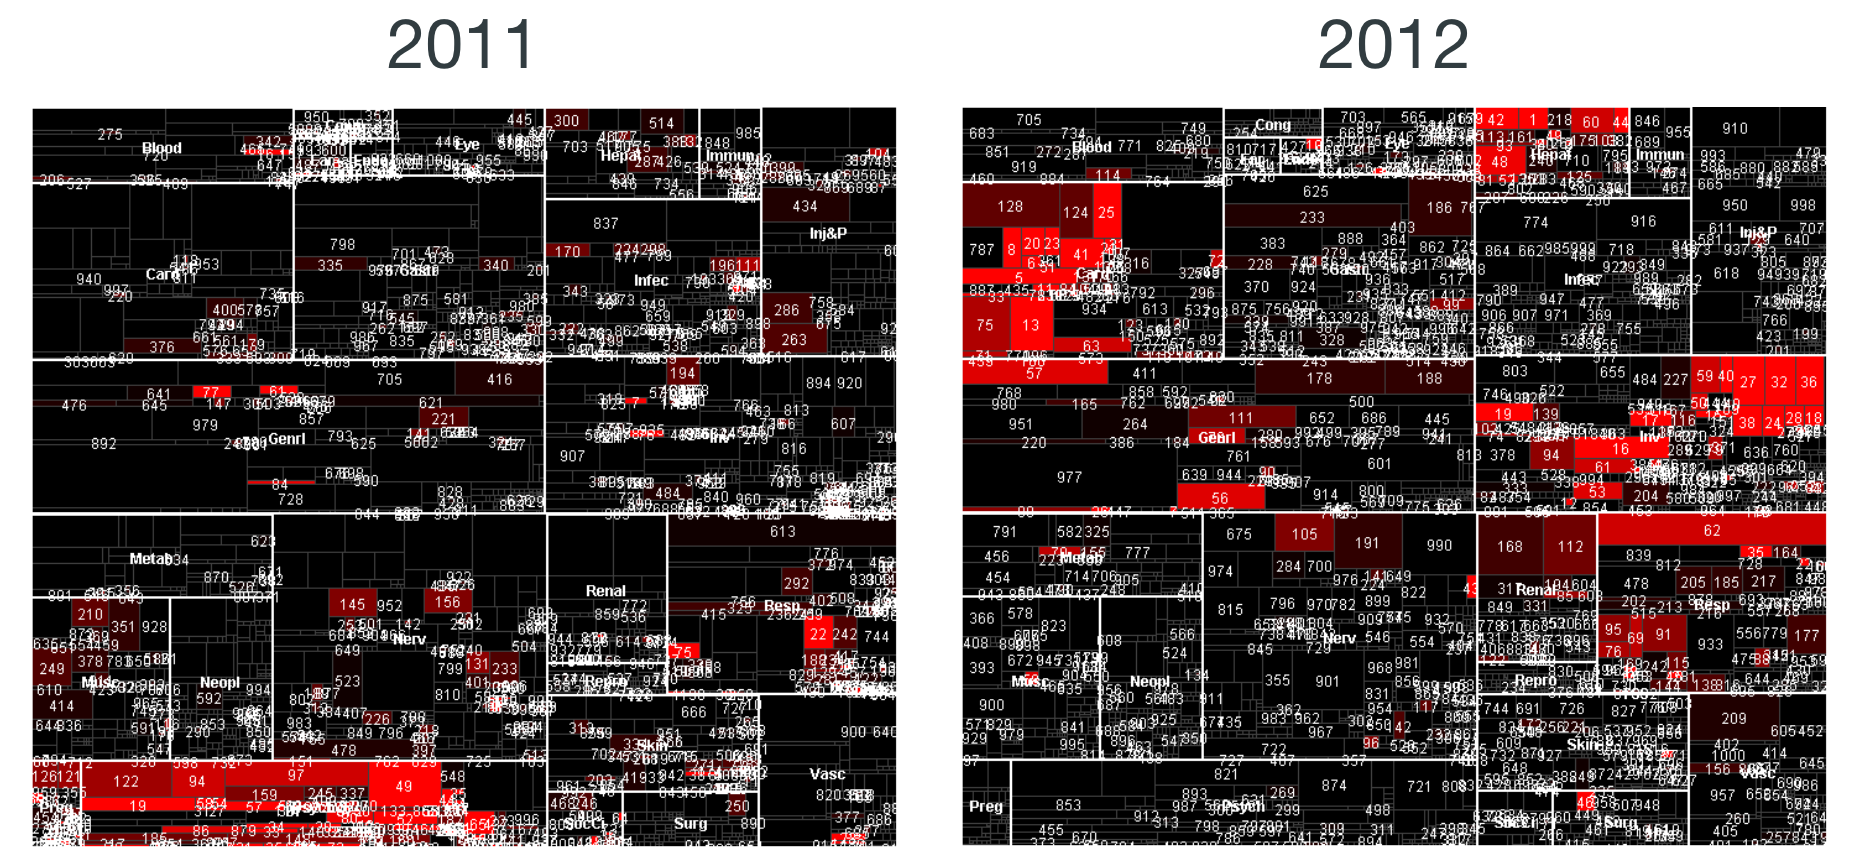
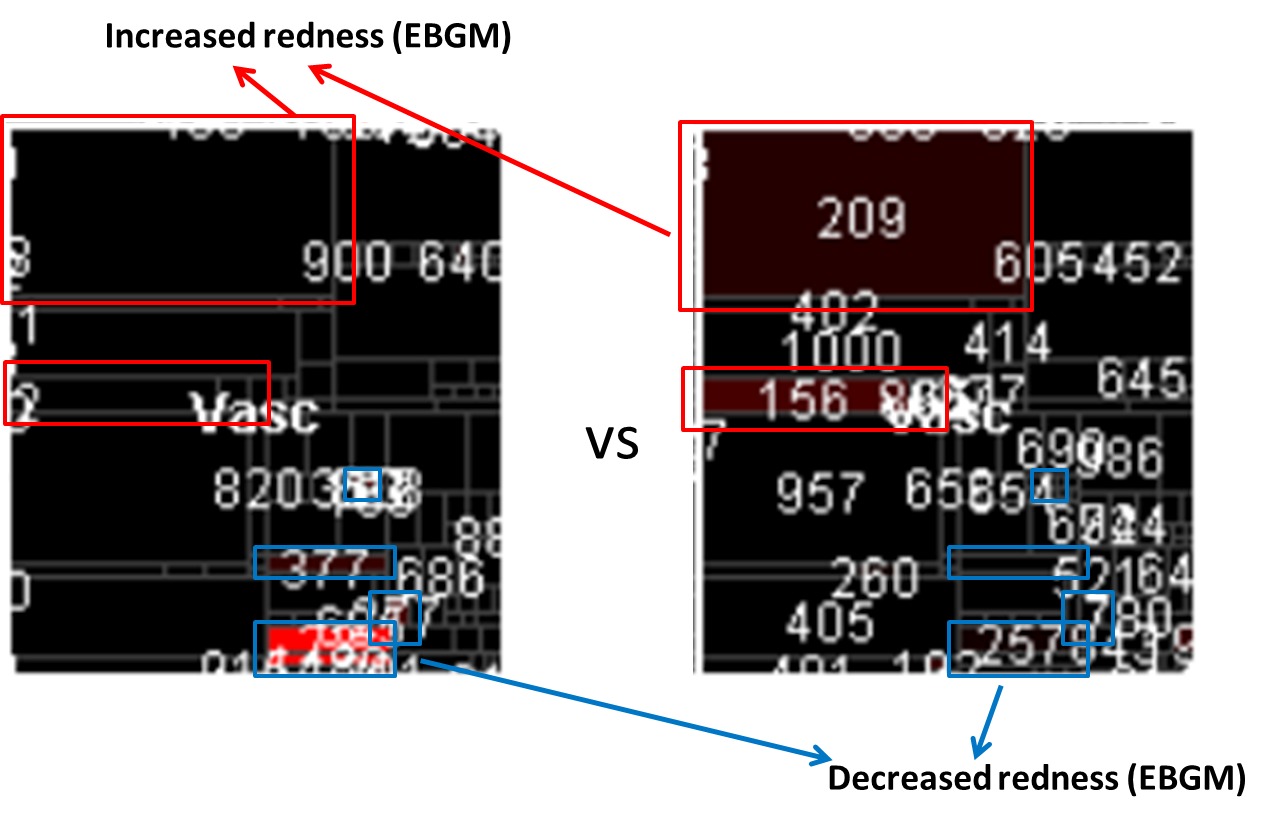
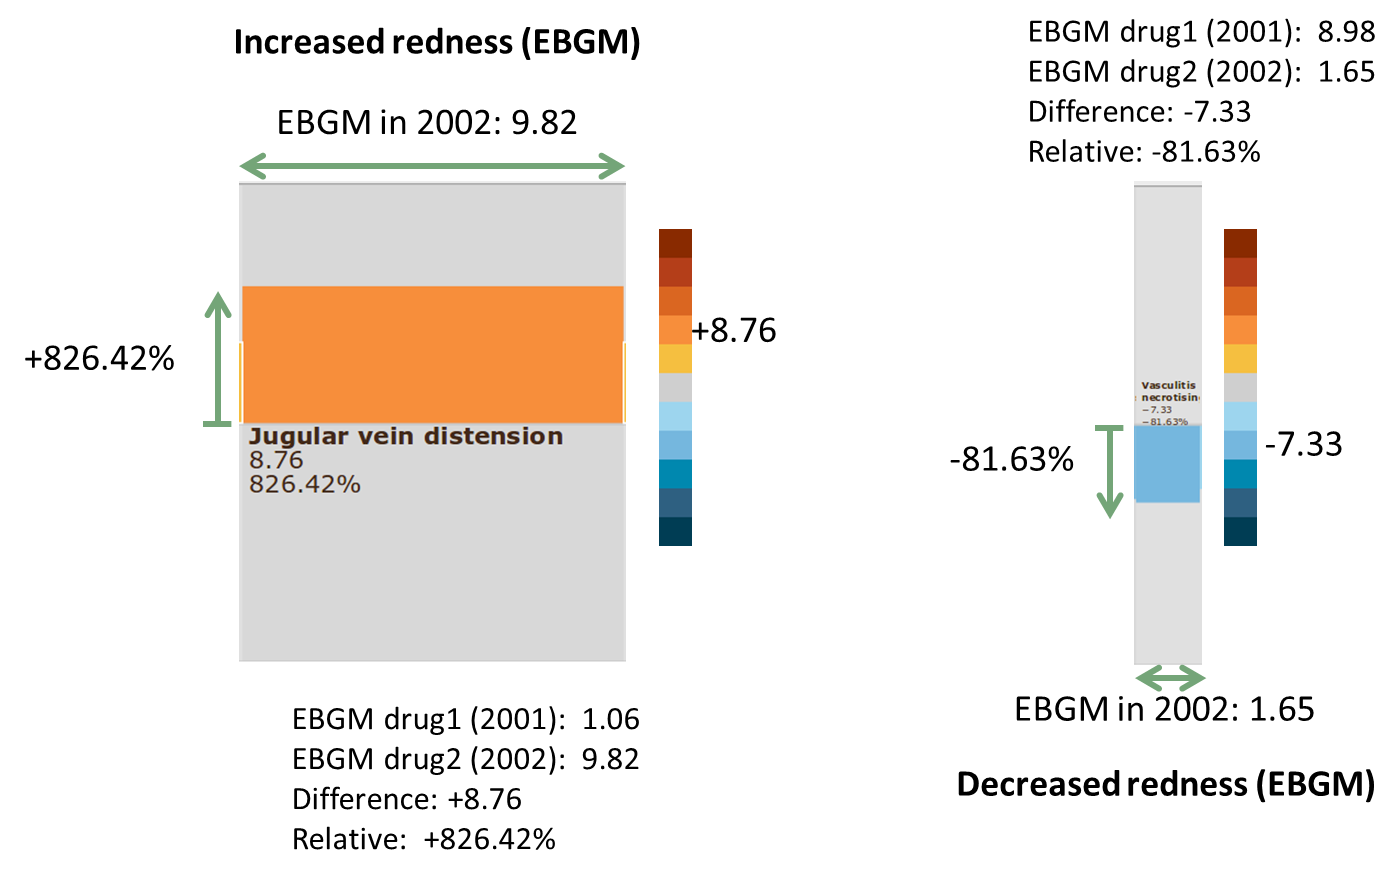
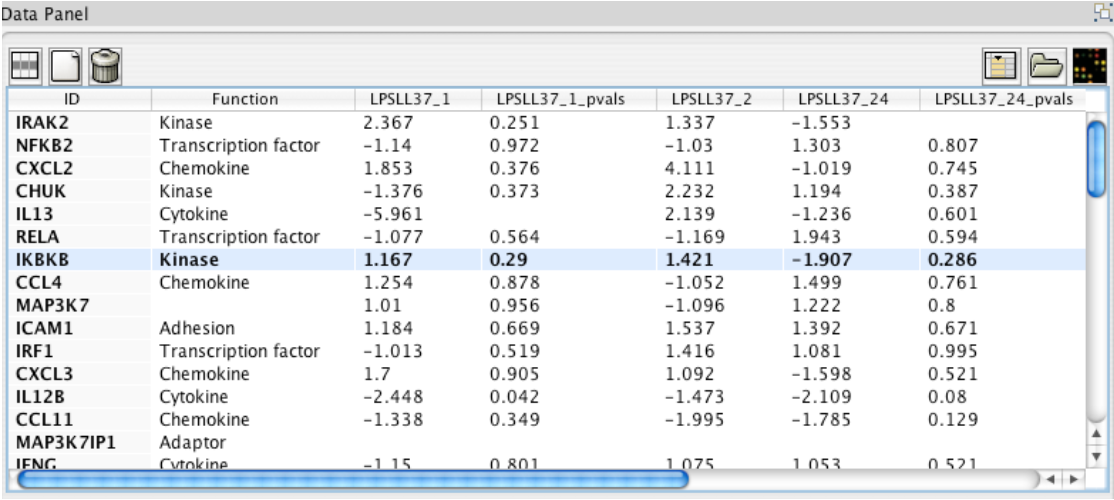
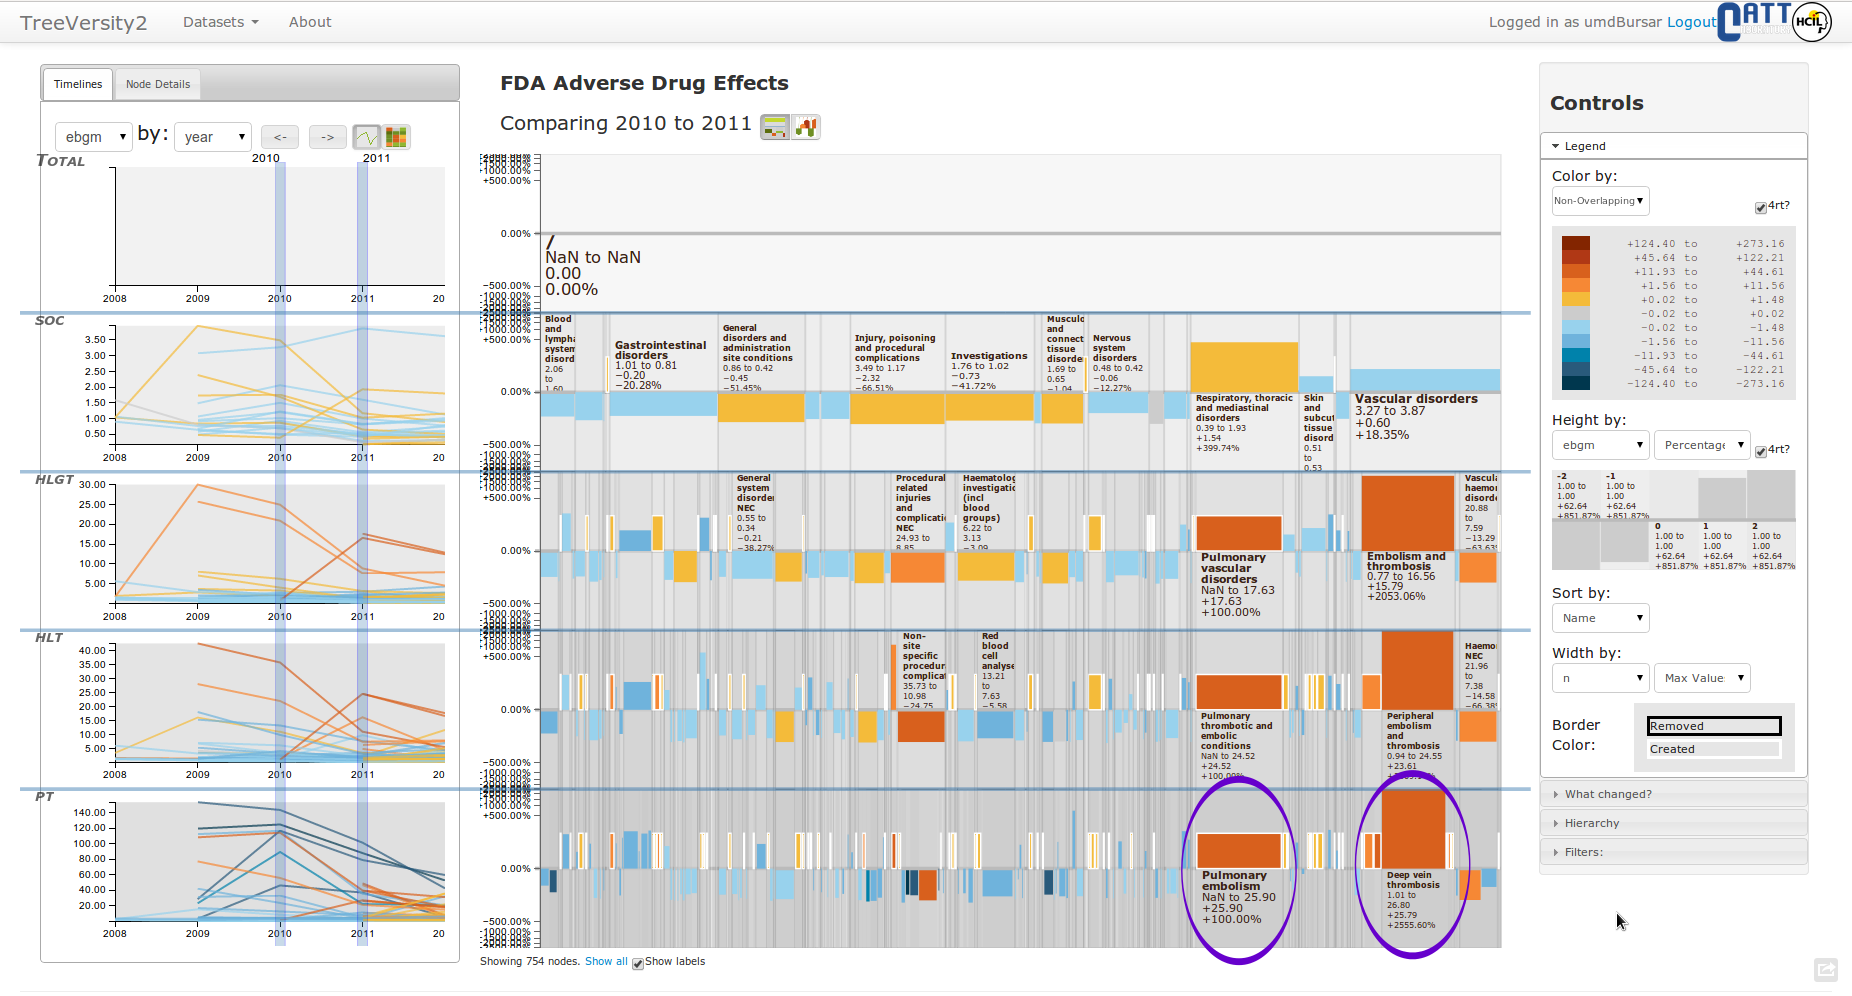 https://treeversity.cattlab.umd.edu/
Health insurance claims
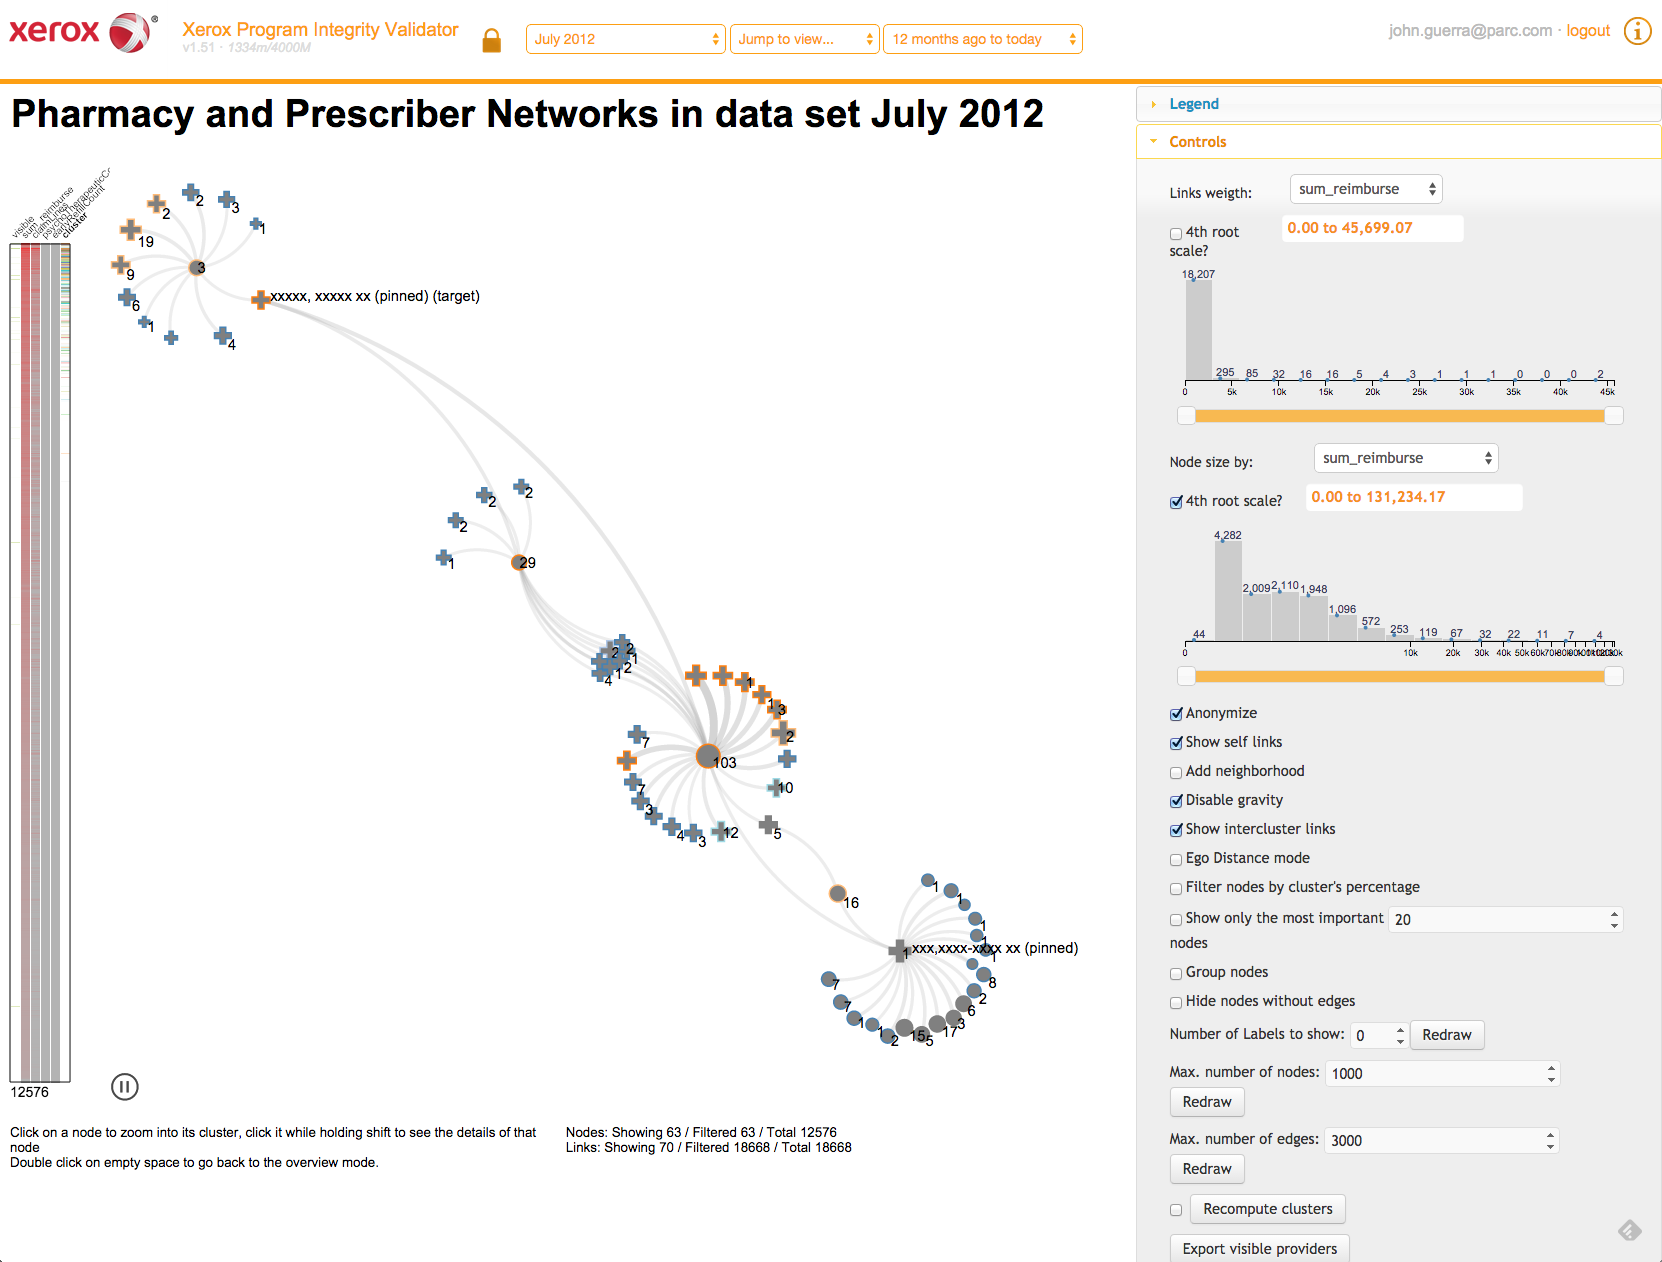
Task: Detect fraud networks
User: Undisclosed Analysts
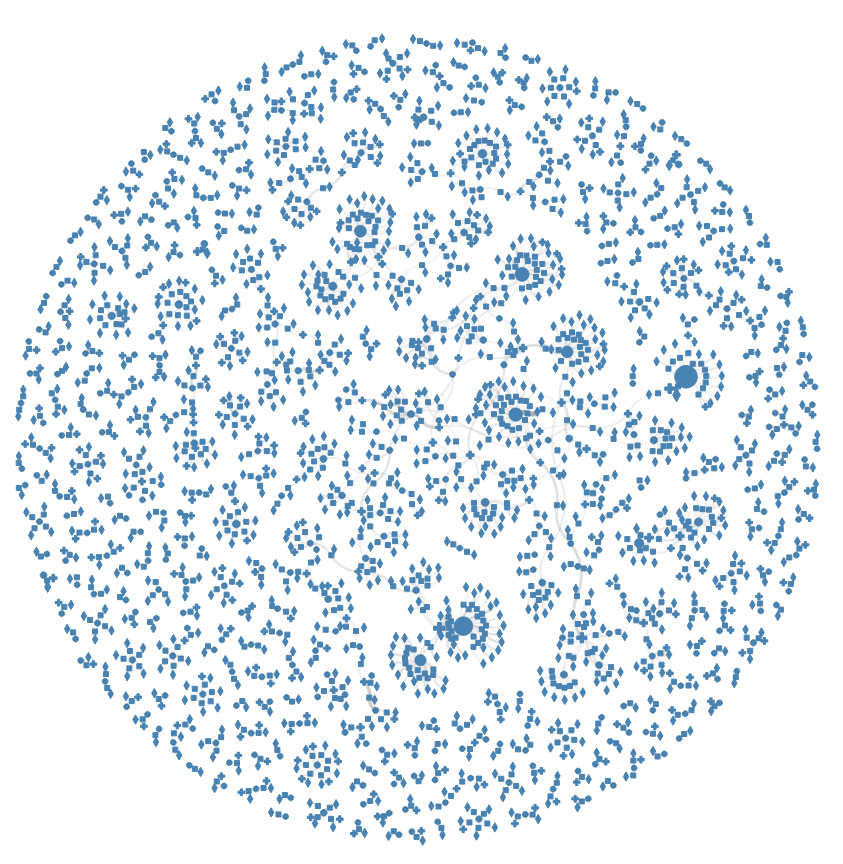
Clustering
Force in a box
Overview
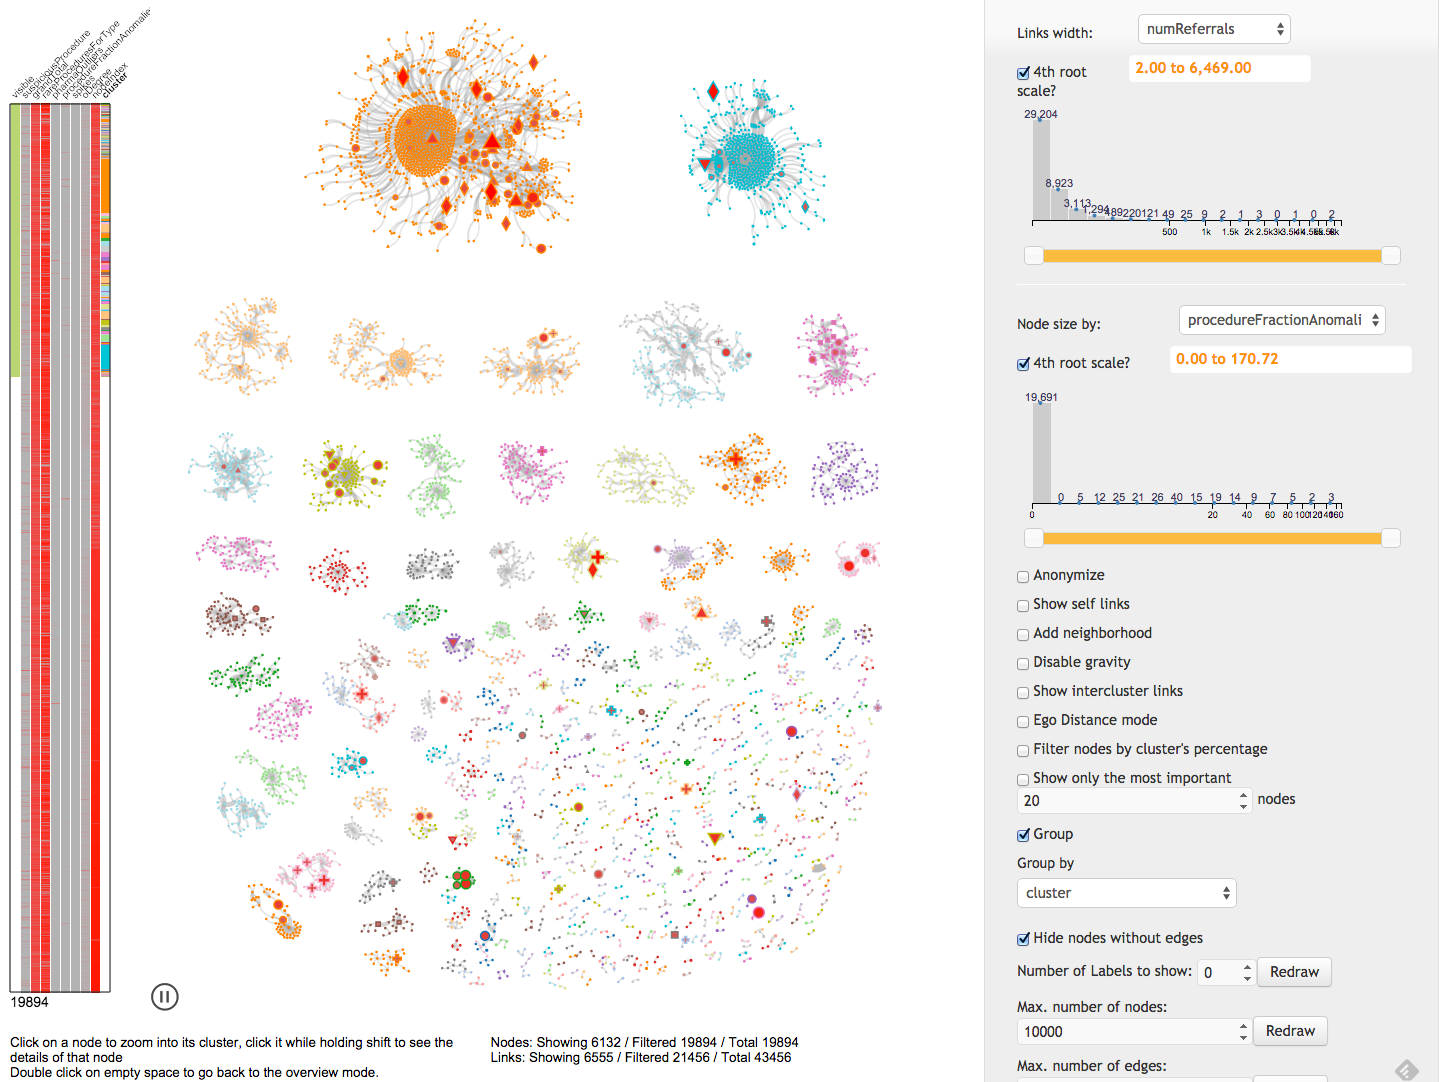
Ego distance
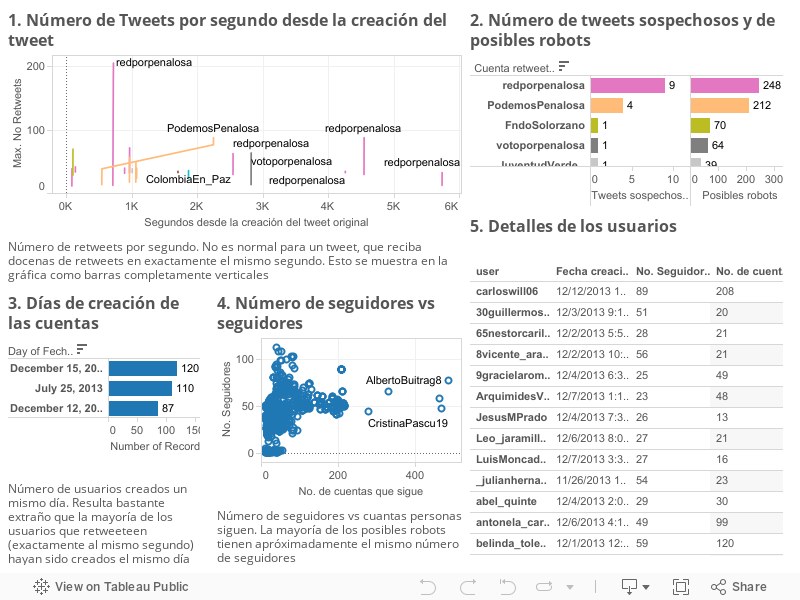
Tweetometro
Task: Twitter behavior during Presidential Elections
User: Me
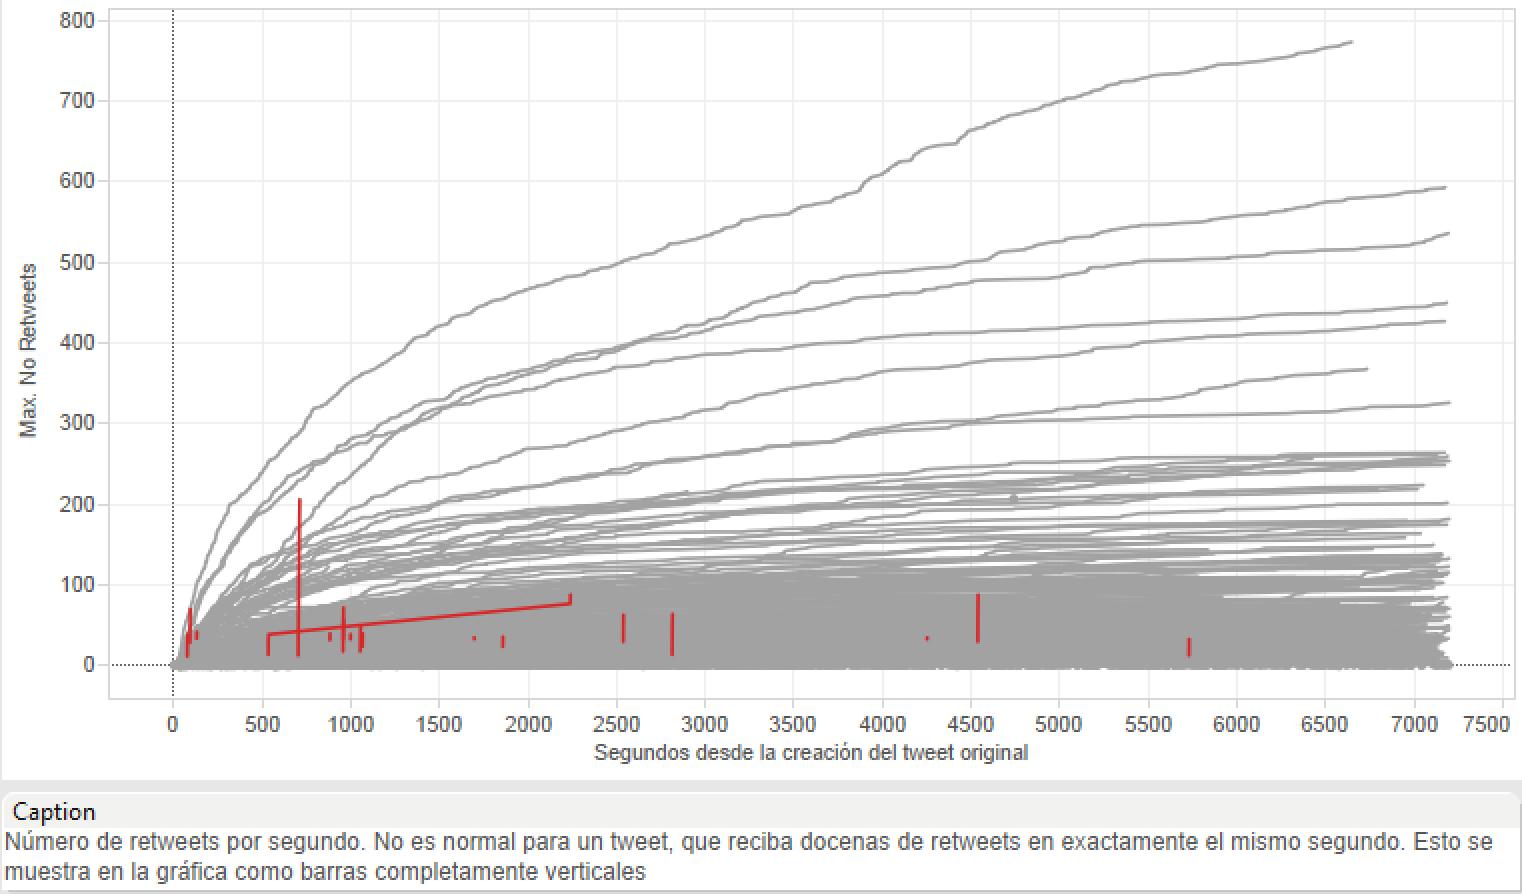
Normal tweets
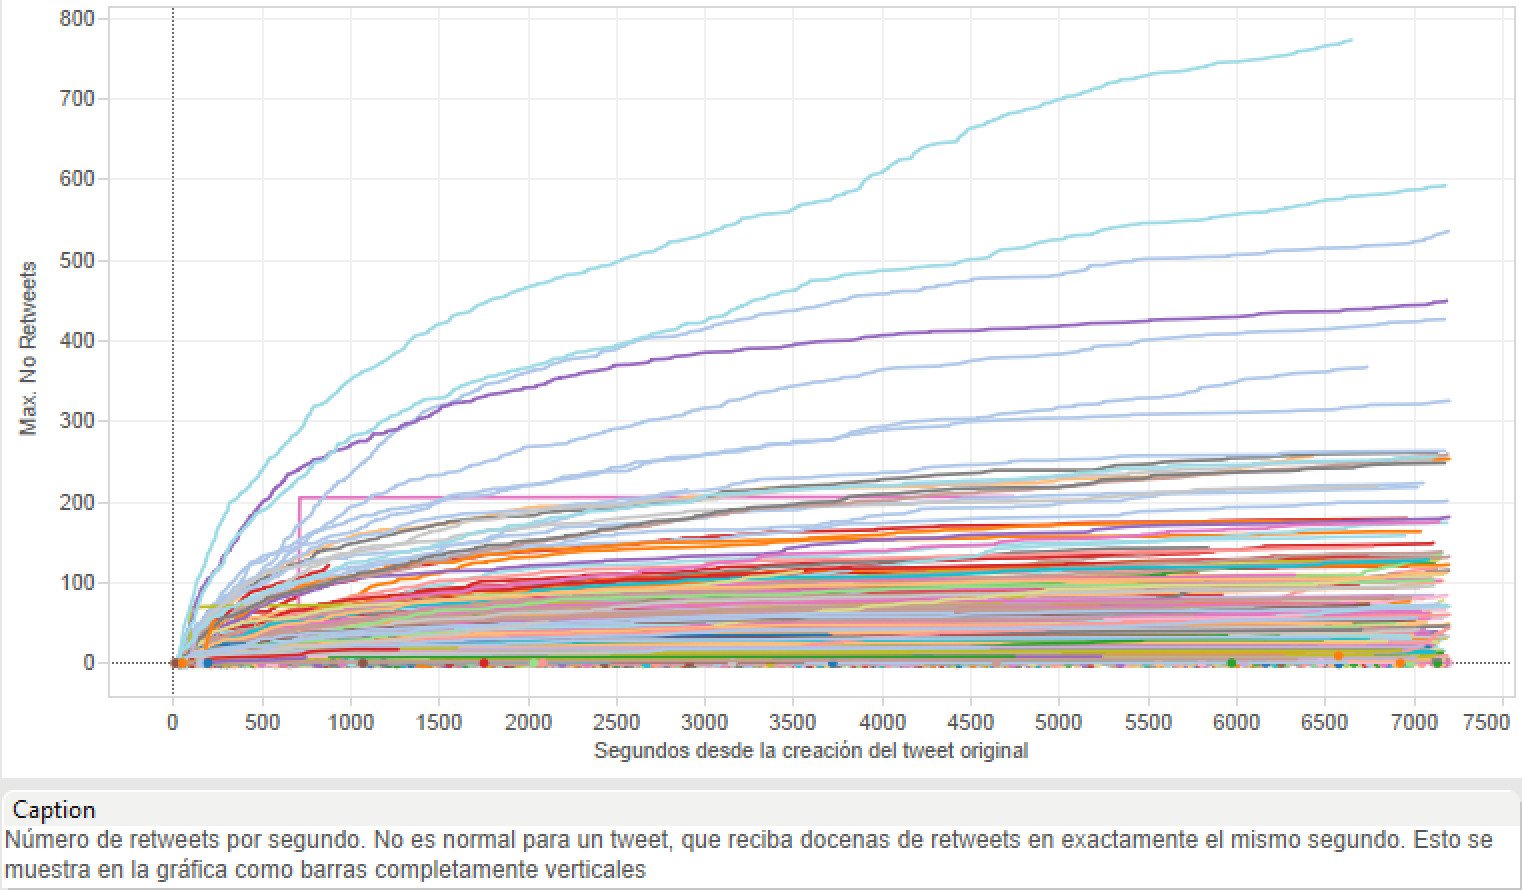
Weird tweets?
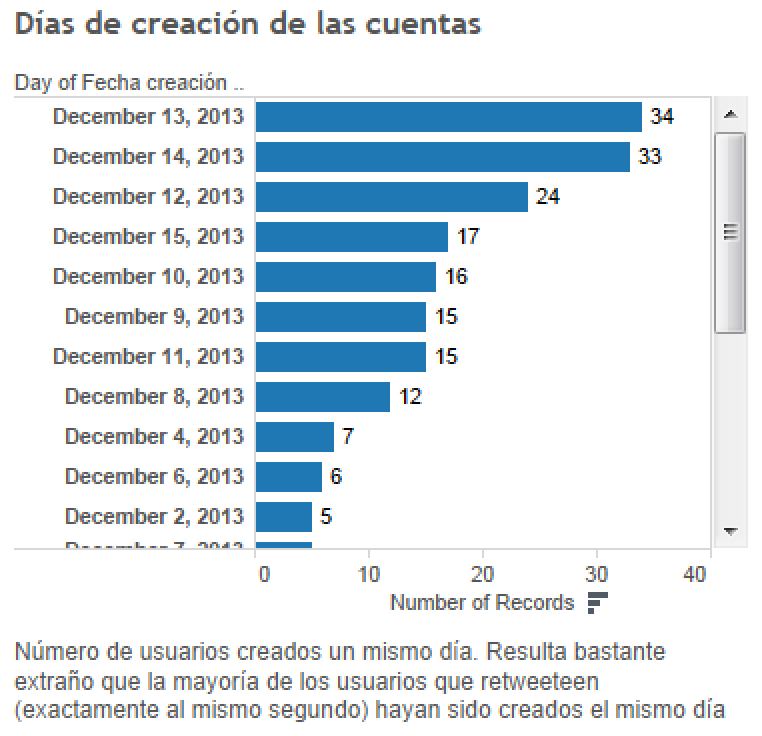
Creation dates
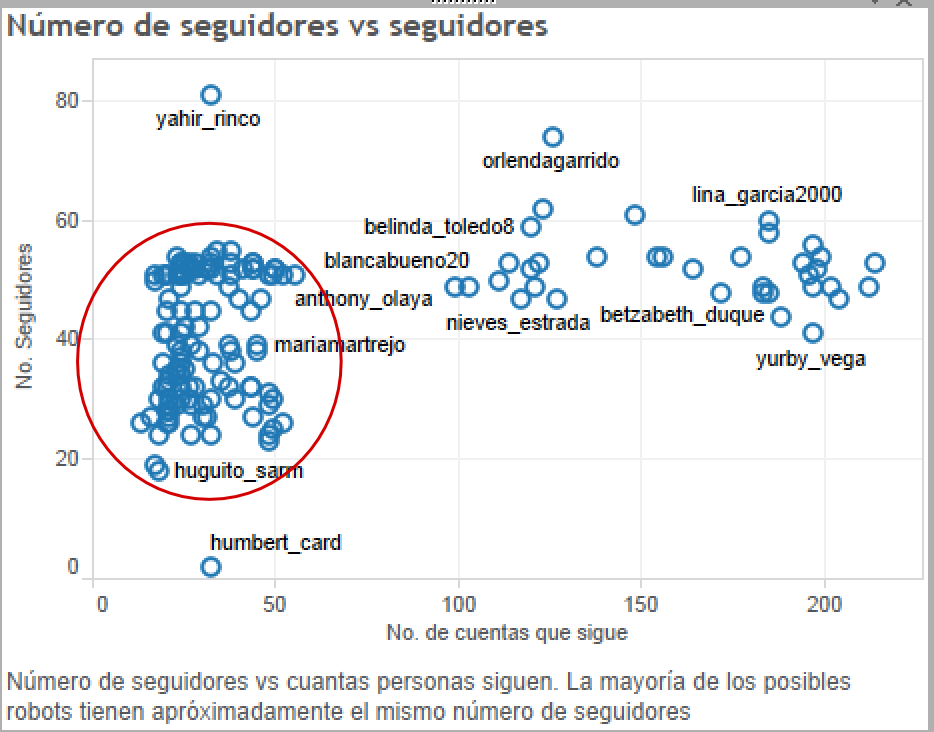
Number of followers
What car to buy?
Task: What's the best car to buy?
User: Me
Normal procedure
Ask friends and family
Problem
That's inferring statistics from a sample n=1
Better approach
Data based decisions
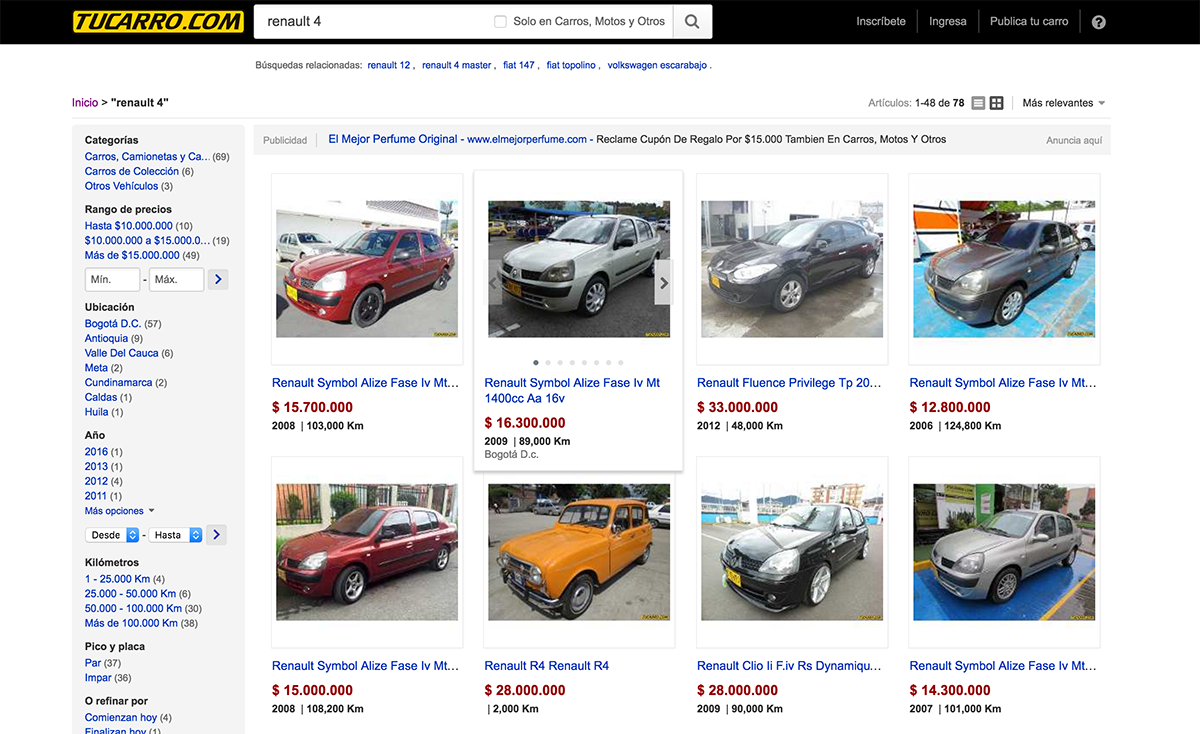 http://tucarro.com
Take home message
- Visualization: Computer + Visuals + Data + Human + Tasks