Visualizing Time
John Alexis Guerra Gómez| ja.guerrag[at]uniandes.edu.co| @duto_guerra
Jose Tiberio Hernández | jhernand[at]uniandes.edu.co
Universidad de los Andes
http://johnguerra.co/lectures/visualAnalytics_fall2019/07_Temporal/
Based onslides from Tamara Munzner
Visualizing Time
Temporal Datasets
- One attrib+ has a timestamp (at any level)
- Granularity ("Year/Month/Day" vs "Year/Month/Day Hour")
- Truncate
- Datepart
- Sometimes is Cyclic
- Seasonality
Idioms
Idiom: Line chart
- Data: Table, many timelines
- Tasks: Compare trends and similarities (with many), locate outliers
- Visual Representation: Line, vertical position, color hue
- Considerations:
- Time usually goes from left to right

Multi-series Line chart
http://blockbuilder.org/mbostock/3884955by mbostockidiom: Horizon charts
- Data: Table, many timelines
- Tasks: Compare trends and similarities (with many), locate outliers
- Visual Representation: Line, vertical position, color luminosity (quant divergent)
- Considerations: Uses much less space

Horizon charts
http://blockbuilder.org/john-guerra/7770baa3383ab777f8ac211deeb66fbcby mbostockCubism
http://square.github.io/cubism/Joyplots
https://blockbuilder.org/john-guerra/2bb5a08bd6f17a5cb4efd6ad6d98973cJoyplot vega-lite
https://observablehq.com/@vega/psr-b1919-21-with-vega-liteidiom: Calendar view
- Data: Table (years), one timeline
- Tasks: Compare trends (by days of the week, month, year), locate outliers
- Visual Representation: Shape, vertical/horizontal position, color hue
- Considerations: Natural view for humans, focus on common time aggregations

Calendar View
http://blockbuilder.org/mbostock/4063318by mbostockidiom: Radial timelines
- Data: Table (years), one timeline
- Tasks: Compare trends (by days of the week, month, year), locate outliers
- Visual Representation: Line, Radial position, color hue (rainbow :( )
- Considerations: Appeals to cyclic nature of time
Gant charts
- Data: Two time attribs (start end)
- Tasks: Summarize duration (features), compare events, identify intersections/dependencies
- Visual Representation: Line, express for time, separate/order/aligned for tasks, color hues
D3 Radial
Stacked Area chart
http://blockbuilder.org/mbostock/3020685by mbostockStacked Radial Area
http://blockbuilder.org/mbostock/3048740by mbostockStacked Radial Area
https://observablehq.com/@d3/radial-area-chartHCIL work on Temporal events
 http://www.cs.umd.edu/hcil/temporalviz/
Time searcher
http://www.cs.umd.edu/hcil/timesearcher/Lifelines
http://www.cs.umd.edu/hcil/lifelines/Lifelines
 http://www.cs.umd.edu/hcil/lifelines/
Lifelines 2
 http://www.cs.umd.edu/hcil/lifelines2/
Lifelines 2 demo
Lifelines 2 video linkSimilian
 http://www.cs.umd.edu/hcil/similan
Similian demo
Similian video linkLifeFlow
 http://www.cs.umd.edu/hcil/lifeflow/
LifeFlow howto
LifeFlow demo
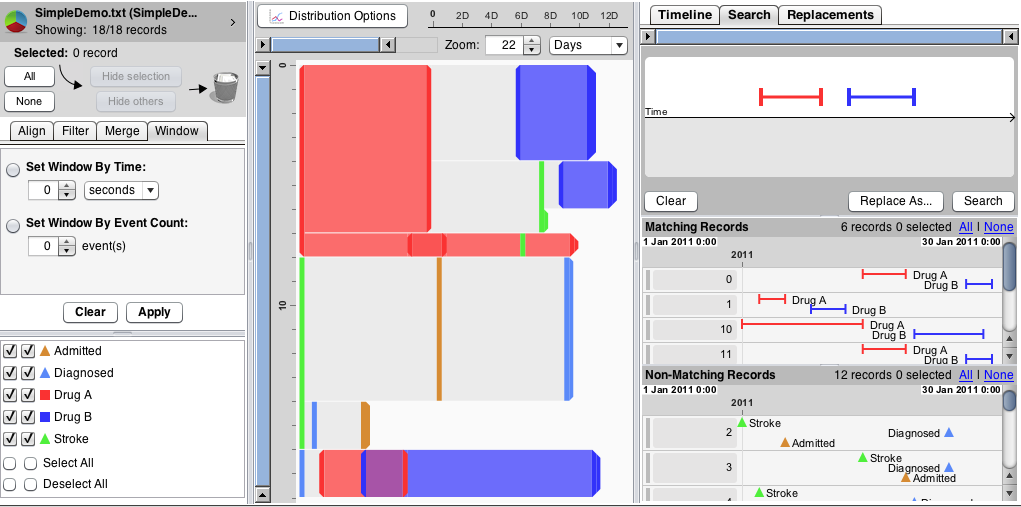
EventFlow
 http://hcil.umd.edu/eventflow/

