Data to Insights
The importance of good data in data analytics

Use spacebar and the arrows to advance slides

Data Analytics
To extract insights from data
But, what are insights?
Story time
What car should I buy?
Normal procedure
Ask friends and family
Problem
That's inferring statistics from a sample n=1
Better approach
Data based decisions

https://tucarro.com
Cars analysis data
- Scraped
- Asking price
- Few examples for rare cases
What is
data analytics?
Why should we
visualize?
Anscombe's quartet
| I | II | III | IV | ||||
|---|---|---|---|---|---|---|---|
| x | y | x | y | x | y | x | y |
| 10.0 | 8.04 | 10.0 | 9.14 | 10.0 | 7.46 | 8.0 | 6.58 |
| 8.0 | 6.95 | 8.0 | 8.14 | 8.0 | 6.77 | 8.0 | 5.76 |
| 13.0 | 7.58 | 13.0 | 8.74 | 13.0 | 12.74 | 8.0 | 7.71 |
| 9.0 | 8.81 | 9.0 | 8.77 | 9.0 | 7.11 | 8.0 | 8.84 |
| 11.0 | 8.33 | 11.0 | 9.26 | 11.0 | 7.81 | 8.0 | 8.47 |
| 14.0 | 9.96 | 14.0 | 8.10 | 14.0 | 8.84 | 8.0 | 7.04 |
| 6.0 | 7.24 | 6.0 | 6.13 | 6.0 | 6.08 | 8.0 | 5.25 |
| 4.0 | 4.26 | 4.0 | 3.10 | 4.0 | 5.39 | 19.0 | 12.50 |
| 12.0 | 10.84 | 12.0 | 9.13 | 12.0 | 8.15 | 8.0 | 5.56 |
| 7.0 | 4.82 | 7.0 | 7.26 | 7.0 | 6.42 | 8.0 | 7.91 |
| 5.0 | 5.68 | 5.0 | 4.74 | 5.0 | 5.73 | 8.0 | 6.89 |
| Property | Value |
|---|---|
| Mean of x | 9 |
| Variance of x | 11 |
| Mean of y | 7.50 |
| Variance of y | 4.125 |
| Correlation between x and y | 0.816 |
| Linear regression | y = 3.00 + 0.500x |
| Coefficient of determination of the linear regression | 0.67 |

https://dabblingwithdata.wordpress.com/2017/05/03/the-datasaurus-a-monstrous-anscombe-for-the-21st-century/
Datasaurus!

https://dabblingwithdata.wordpress.com/2017/05/03/the-datasaurus-a-monstrous-anscombe-for-the-21st-century/
The purpose of visualization
is insight,
not pictures

But what are insights?
- Deep understanding
- Meaningful
- Non obvious
- Actionable
- Based on data
My insights toolbelt?

What do I use?

Let me show you
more insights
Another story
A new niece 👶🏼!!!
What are Colombia's most common names?
Colombian National Registry
- Me: Hey, do you have data of Colombians' names?
- CNR: Sure of course!
- Me: Great, can I have all of them
- CNR: Of course, it is just $0.40 per name
- Me: 🤦♂️ Failed!
A couple months later...
- Brother: What school do you like for your nephew?
- Me: I wonder which one has the best scores? 🤔🤔🤔🤔
What we learned
- No data 👉🏼 No Insights
- Dig deeper
- Ask questions
- The 👺 is in the details
More Insights
Covid Colombia
Presidential Election
Remember
- 👉🏼 Insights! 👈🏼
- No data 👉🏼 No Insights
- Bad Data 👉🏼 No Insights
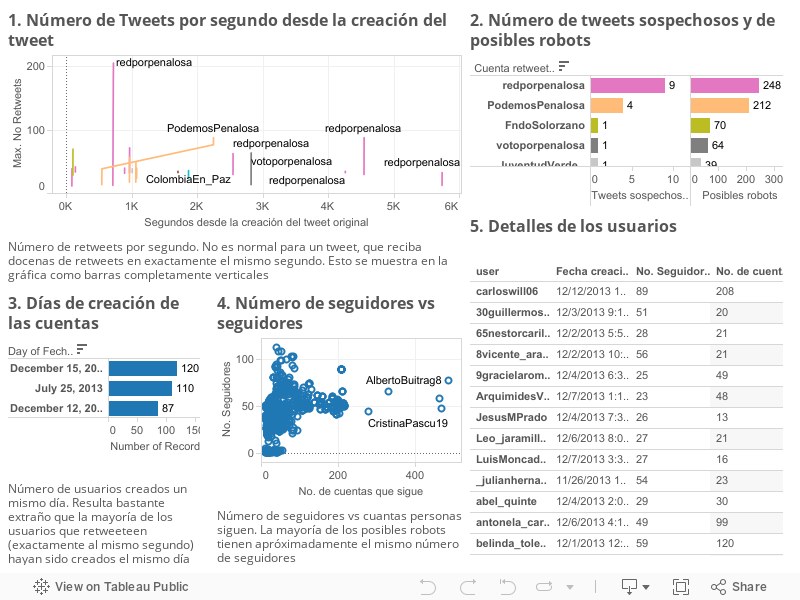
Influentials

Other Insights!
Results Bogota Council
https://public.tableau.com/app/profile/john.alexis.guerra.g.mez/viz/votosConcejo/Reject
Buzzwords
Or: No coma Machine Learning, follow the insights
Data Science ?
Data science is an inter-disciplinary field that uses scientific methods, processes, algorithms and systems to extract knowledge and insights from structured and unstructured data
... to work effectively with heterogeneous, real-world data and to extract insights from the data using the latest tools and analytical methods.
However
Popularity
Data Science is way more than Machine Learning!
The purpose of visualization
is insight,
not pictures
The purpose of data analysis
is insight,
not (just) models

Machine Learning?

What can you use ML for?
- Photos 🖼
- Videos 📹
- Document/Text Processing 📃
- Speech 👄👂🏼
- Structured data 💾?
What can I detect on photos 🖼?
- Objects 🐈 🐕 🍎
- Faces 👱🏽♂️👱♀️
- Celebrities 🍾
- Landmarks 🗼
- Text in images 🗼
How can I use it?
Develop locally
Pose Detection
https://johnguerra.co/viz/mlPose/Object Detection
https://johnguerra.co/viz/mlObject/How can I use it?
- Big companies 👉 ML as a service
- You pay per request 💵 ~US$1.0 per every 1000 requests
Demos
What can I do with documents 📃?
- OCR 🖼 → 🔤
- Sentiment analysis 😆😡
- Topic extraction 🟡🟠🟣
- Entities detection
- Political Affiliation? 👔🎉
- Psychological Profile?
Demos
What can I do with Speech 👄👂🏼?
- Speech recognition 👂🏼
- Speech generation 👄
That's hip, but...
The purpose of visualization is insight, not pictures
The purpose of data analytics is insight, not (just) models
Traditional
Pros:
Cons:
|
Data Mining/ML
Pros:
Cons:
|
InfoVis
Pros:
Cons
|
Rappi
How is Rappi doing on Twitter?
- 30k tweets in a week of 2019
Approach 1
😡😠😒😐😏😃🥰?
- Machine learning 🎩! ???
- Detects sentiment ! ???
I hired a data 🐒 (might be me)
Analyzed 180 tweets
- 😡😠😒😐😏😃🥰
Here are some of them


Would you hire this data 🐒?
Well, actually
- It wasn't a data 🐒
- It was a 💻
- Would you use it?
Well, actually, actually
- It wasn't just any computer
- It was ML as a service by Google
- It costs $$$
Will you trust it?
- Spanish is just too complicated
- These models are trained with 🇪🇸 examples
Approach 2
Approach 3
It's up to you!
- Interactivity 👉 Ask questions
- Slice and dice
- Overview first, Zoom/Filter, then details on demand
Rappi Dashboard Link 😉
¡No coma Machine Learning, coma 🍖!
Machine Learning
- Prediction vs Training
- How was it trained?
- Garbage in - garbage out
AI ?
Big Data?
You might have heard of the Vs of Big Data
- Volume
- Velocity
- Variety
- and Veracity and Value
Too ambiguous!! 🤦🏽♀️ Let's go beyond that
How Big is big?
Can you fit it in one computer?
Yes? 👉🏼 Then, is not really big 🤷🏽♀️
Why this criteria?
Big data 👉🏼 Big overhead
Example: photo collection
- One photo 👉🏼 10MB
- 1k photos in a 📱 👉🏼 10MB * 1k = 10000MB = 10GB
- 50k photos in your 💻 👉🏼 10MB * 50k = 500GB
Big Data? 🙅🏽♂️
How many blue photos are in my collection?
How do you compute this?
- Put all your photos in one 💻
- Go through all the collection and count the blue ones
Flickr scale
80+ trillion photos (80'''000''000'000.000)
That's big data
How many blue photos are on Flickr?
How do you compute this?
- Distribute the data among 100s of 💻💻💻s. (a cluster)
- Compute subtotals on each data part. (Map)
- Aggregate the subtotals into one big total. (Reduce)
How many computers do you need?
What if one computer breaks? ☢️
Conclusion
Big Data? 👉🏼 Only if it doesn't fit on one 💻
⚠️ Use it only if you must ⚠️
But don't panic!
Let me share a secret
🤫
My wife tells it to me all the time!
Size doesn't really matter
What matters are the insights 👍
Insights ?
Machine Learning?
Big Data Technologies
Technologies
- MapReduce (Hadoop, Hive, pig, Spark ...)
- NoSQL Databases (Redis, Cassandra, MongoDB, Neo4J)
- Distributed Relational (SQL) Databases (MySQL, PostgreSQL, Oracle, SqlServer)
- Many others
Hadoop
- Computing platform for big data
- Uses clusters for storing and processing the data
Hadoop Architecture

Spark
A distributed computing alternative of to map reduce.
- Easier to use
- Integrates better with traditional programming models
NoSQL Databases
- Scalable storage platforms that use techniques different to traditional SQL databases
- Sacrifices features for performance
Types of NoSQL
- Column Oriented: Cassandra, HBase, Redshift ...
- Key-value: Redis, memcached, Aerospike ....
- Document based: MongoDB, CouchDB, DynamoDB ...
- Graph based: Neo4J, Titan, ...
Bonus
Distributed Relational DB
- You can also use traditional databases on a distributed way.
- Divides the database into shards.
- Usually doesn't scale that well.
Others
- Google DataFlow
- Google's replacement for MapReduce based on flows.
- Supposed to scale better.
- AFAIK can only be used with Google's Cloud.
Types of Visualization
- Infographics
- Scientific Visualization (sciviz)
- Information Visualization (infovis, datavis)
Infographics

Scientific Visualization
- Inherently spatial
- 2D and 3D

Information Visualization

Visualization Mantra
- Overview first
- Zoom and Filter
- Details on Demand
Data Types
| 1-D Linear | Document Lens, SeeSoft, Info Mural |
| 2-D Map | GIS, ArcView, PageMaker, Medical imagery |
| 3-D World | CAD, Medical, Molecules, Architecture |
| Multi-Var | Spotfire, Tableau, GGobi, TableLens, ParCoords, |
| Temporal | LifeLines, TimeSearcher, Palantir, DataMontage, LifeFlow |
| Tree | Cone/Cam/Hyperbolic, SpaceTree, Treemap, Treeversity |
| Network | Gephi, NodeXL, Sigmajs |
Visualization Science
Problem Abstraction
What/Why/How
- What is visualized?
- data abstraction
- Why is the user looking at it?
- task abstraction
- How is visualized?
- idiom visual encoding and interaction

Marks and Channels
Analyze Idiom Structure
Marks
Channels

Channel Types

Bonus
Other Insights
FDA
Task: Change in drug's adverse effects reports
User: FDA Analysts
State of the art


 https://treeversity.cattlab.umd.edu/
Health insurance claims
Task: Detect fraud networks
User: Undisclosed Analysts

Clustering
Overview

Ego distance

Who to follow on Twitter
https://johnguerra.co/slides/untanglingTheHairball/#/Who am I?

PhD


Silicon Valley


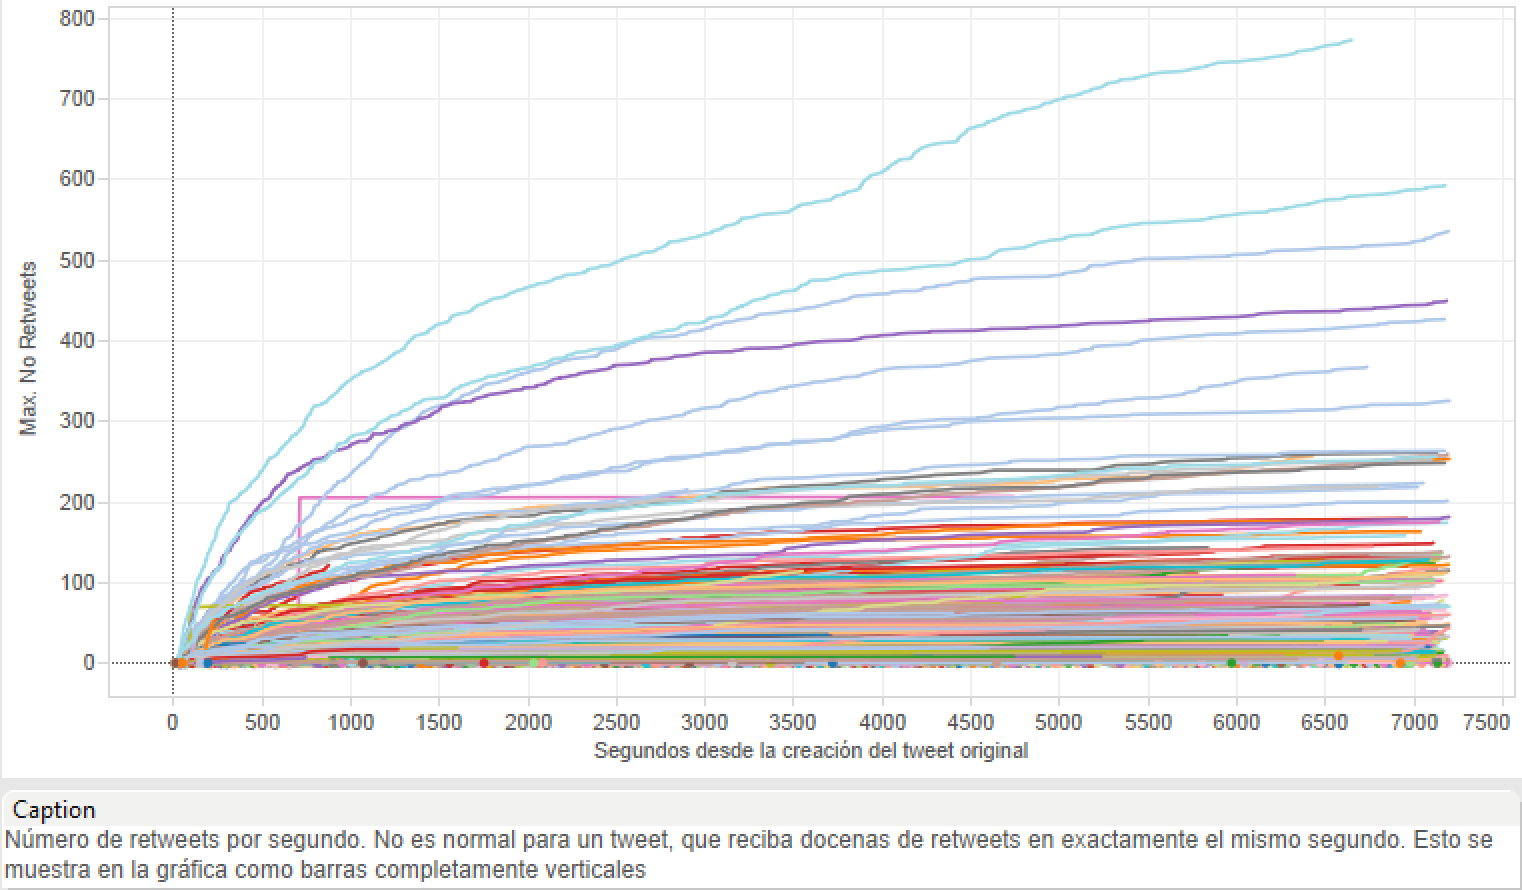
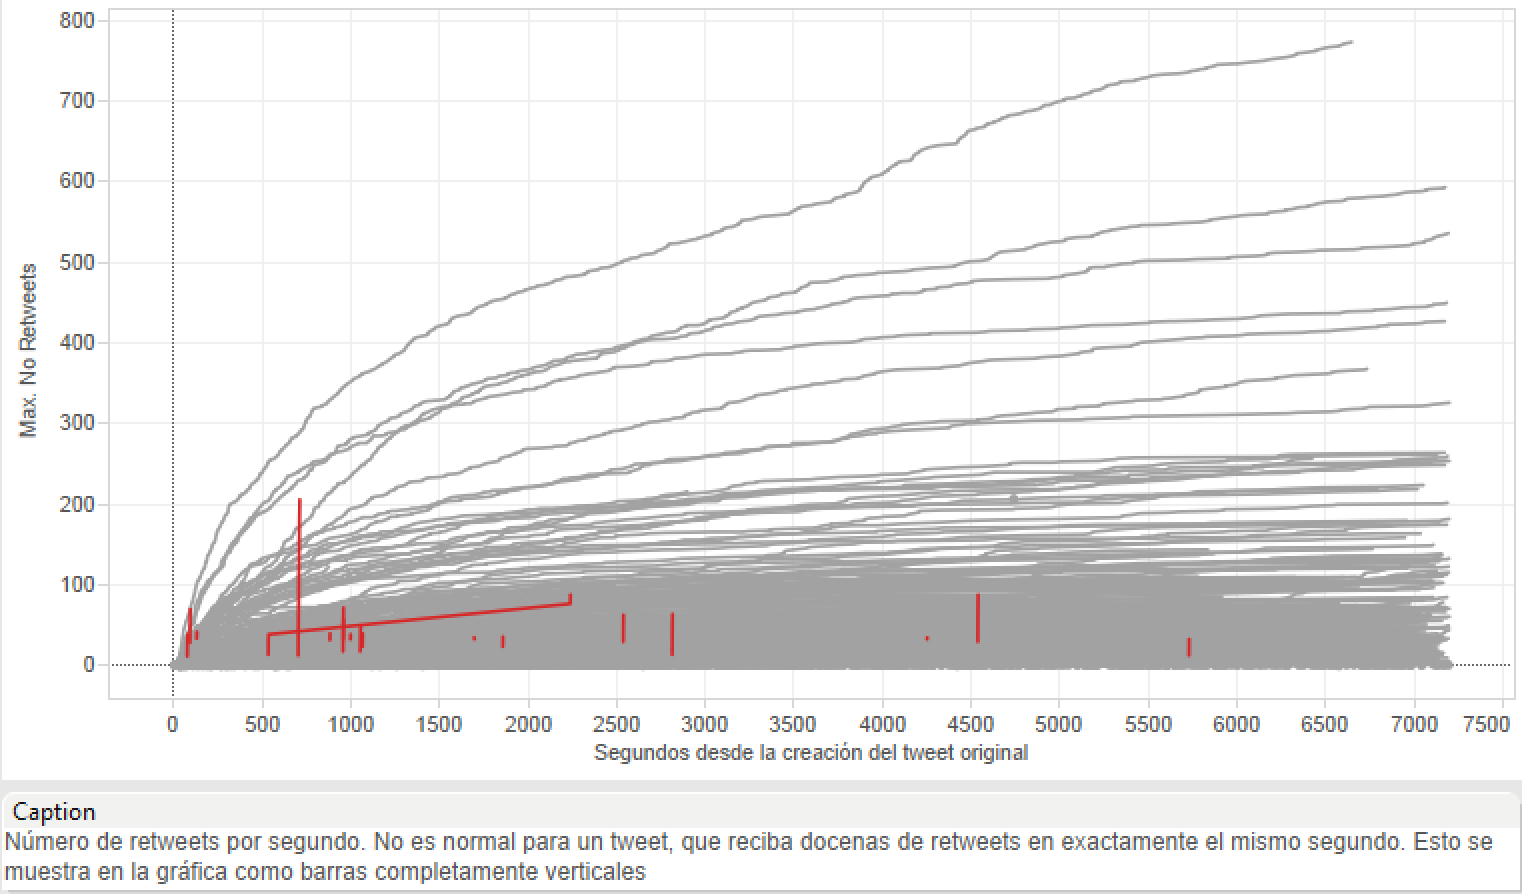
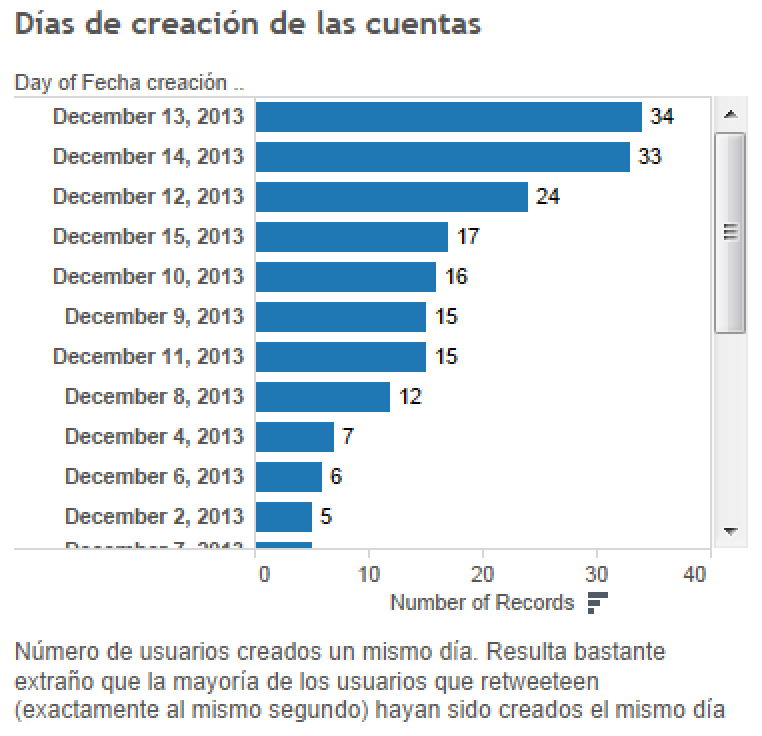
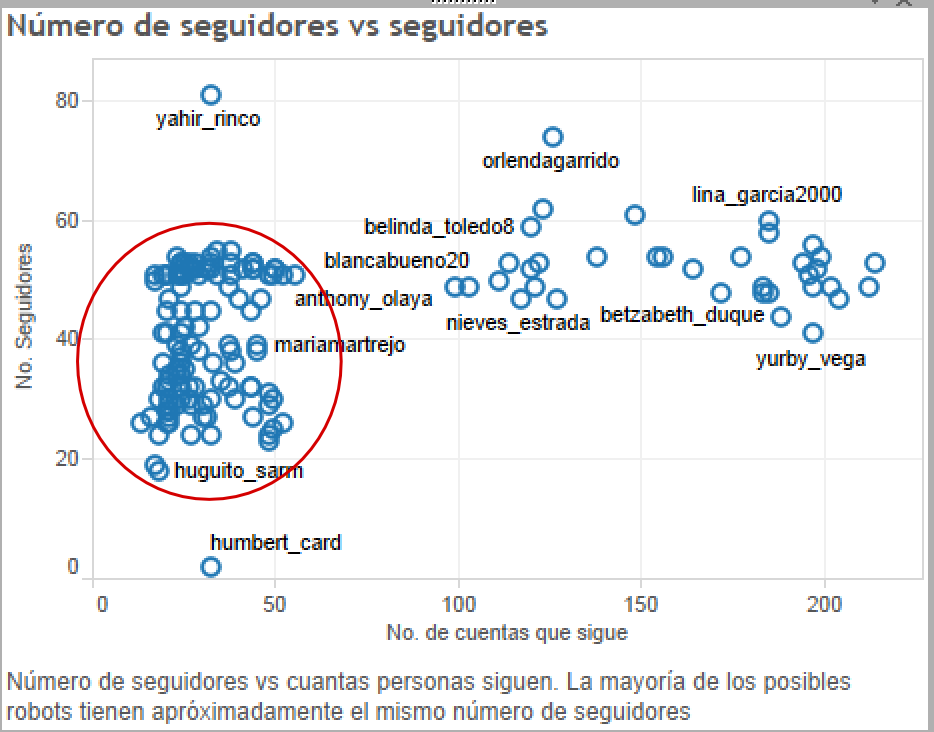
Twitter Influentials
Twitter election analysis