Visualizing
Temporal Data
Information Visualization
John Alexis Guerra Gómez | john.guerra[at]gmail.com | @duto_guerra
https://johnguerra.co/lectures/information_visualization_spring2021/07_Time/
https://johnguerra.co/lectures/information_visualization_spring2021/07_Time/

What We Are Going to Learn
- Line charts
- Area charts
- Other representations
- Radial idioms
- Modern represtations
- HCIL work on temporal
- Tips
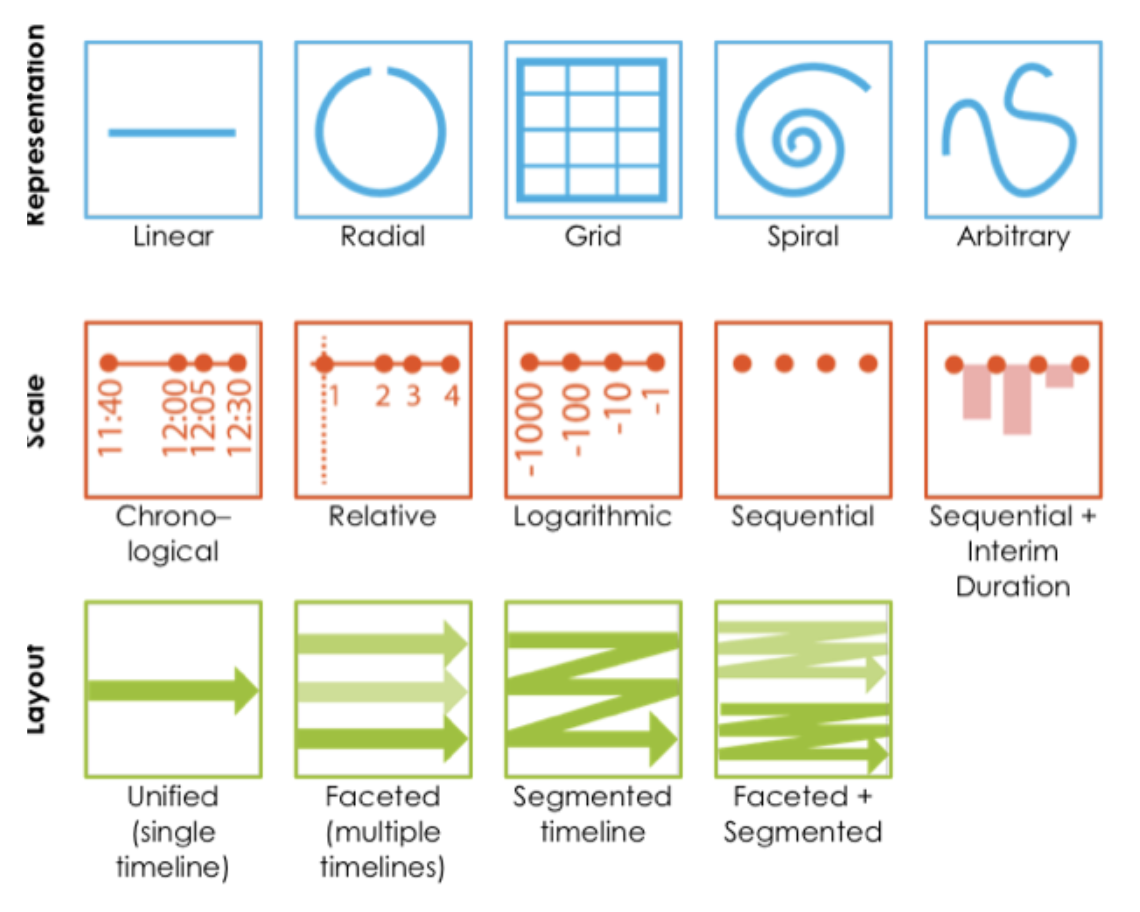
Visualizing Time
Temporal Datasets
- One attribute has a timestamp (at any level)
- Granularity ("year/month/day" vs. "year/month/day/hour")
- Truncate
- Datepart
- Sometimes is cyclic
- Seasonality
Line Charts
Idiom: Line Chart/Dot Plot
- One key, one value
- Data: two quantitative attributes
- Mark: points and line connection marks between them
- Channels:
- Aligned lengths to express quant value
- Separated and ordered by key attribute into horizontal regions
- Task: find trend
- Connection marks emphasize ordering of items along key axis by explicitly showing relationship between one item and the next
- Scalability: hundreds of key levels, hundreds of value levels

Choosing Bar vs. Line Charts
- Depends on type of key attribute
- Bar charts if categorical
- Line charts if ordered
- Do not use line charts for categorical key attributes
- Violates expressiveness principle
- Implication of trend so strong that it overrides semantics!
- “The more male a person is, the taller he/she is.”

Line Chart Aspect Ratio
- 1: banking to 45 (1980s)
- Cleveland perceptual argument: most accurate angle judgement at 45
- 2: multi-scale banking to 45 (2006)
- 3: arc length-based aspect ratio (2011)

Idiom: Dual-Axis Line Charts
- Controversial
- Acceptable if commensurate
- Beware, very easy to mislead!

Idiom: Indexed Line Charts
- Data: two quantitative attributes
- One key and one value
- Derived data: new quantitative value attribute
- Index
- Plot instead of original value
- Task: show change over time
- Principle: normalized, not absolute
- Scalability same as standard line chart
Area Charts
Idiom: Streamgraph
- Generalized stacked graph
- Emphasizing horizontal continuity
- Vs. vertical items
- Data:
- One categorical key attribute (artist)
- One ordered key attribute (time)
- One quantitative value attribute (counts)
- Derived data
- Mark: layers (areas)
- Height encodes counts
- One quantitative attribute (layer ordering)
- Scalability:
- Hundreds of time keys
- Dozens to hundreds of artist keys
- More than stacked bars, since most layers don’t extend across whole chart

Streamgraph RIO2016

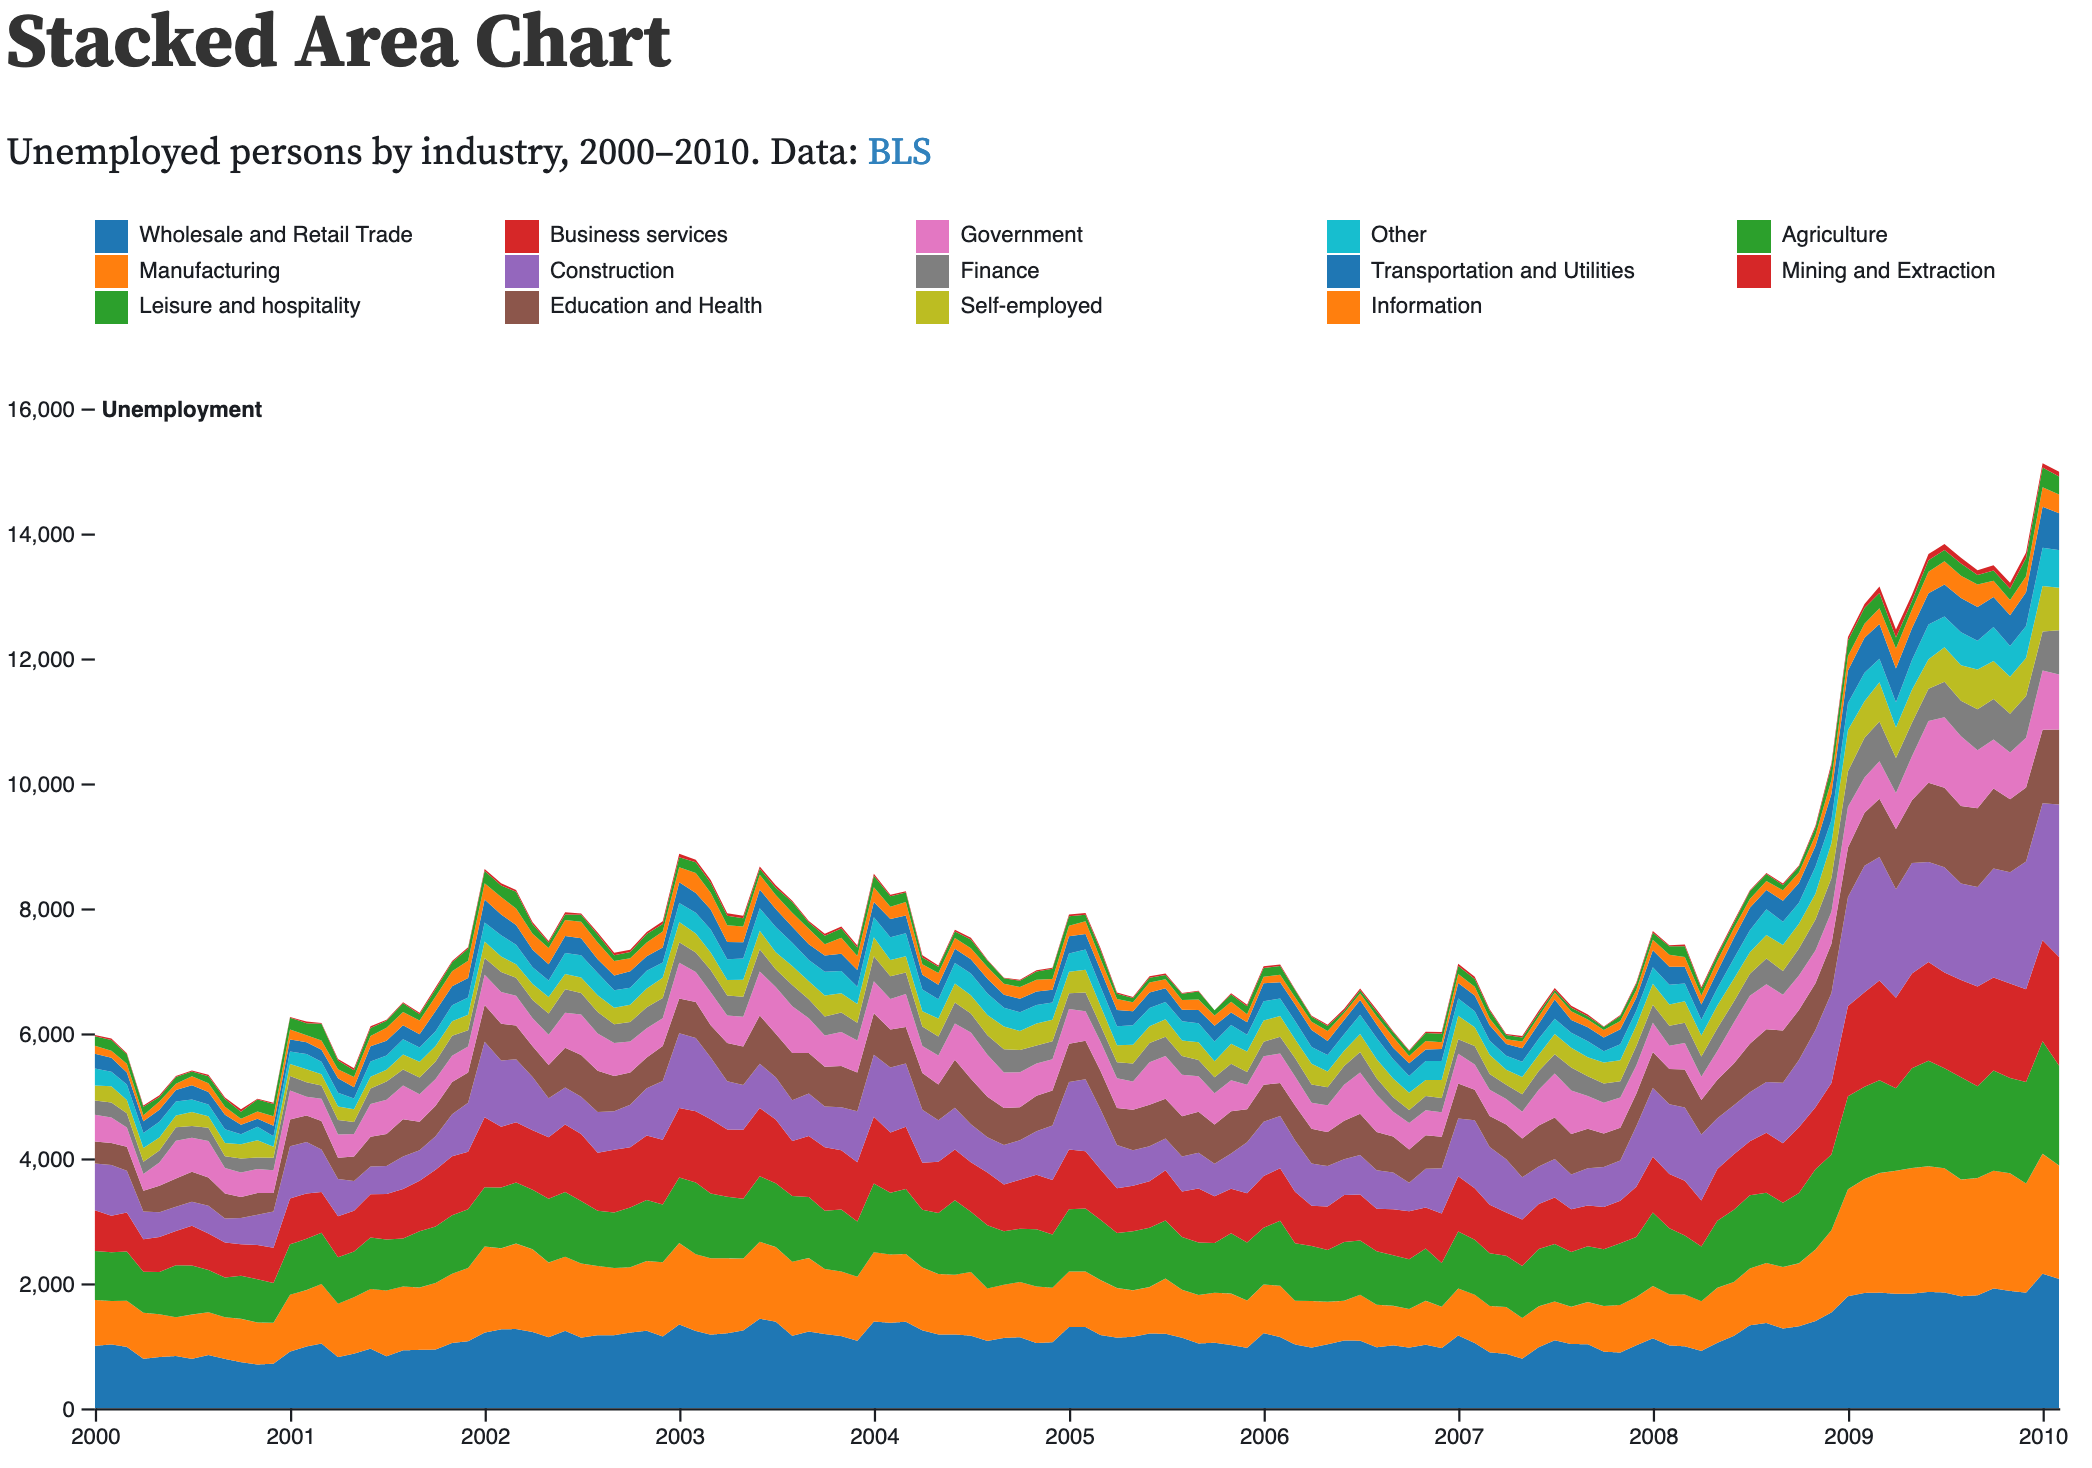
Stacked Area Charts
- Similar to streamgraphs
- Task: identify trends in total
- More accurate
- Less fancy (enjoy)
- Choose first category wisely
Other Representations
Gantt Charts
- Data: two time attributes (start end)
- Tasks: summarize duration (features), compare events, identify intersections/dependencies
- Visual representation: line, express for time, separate/order/aligned for tasks, color hues

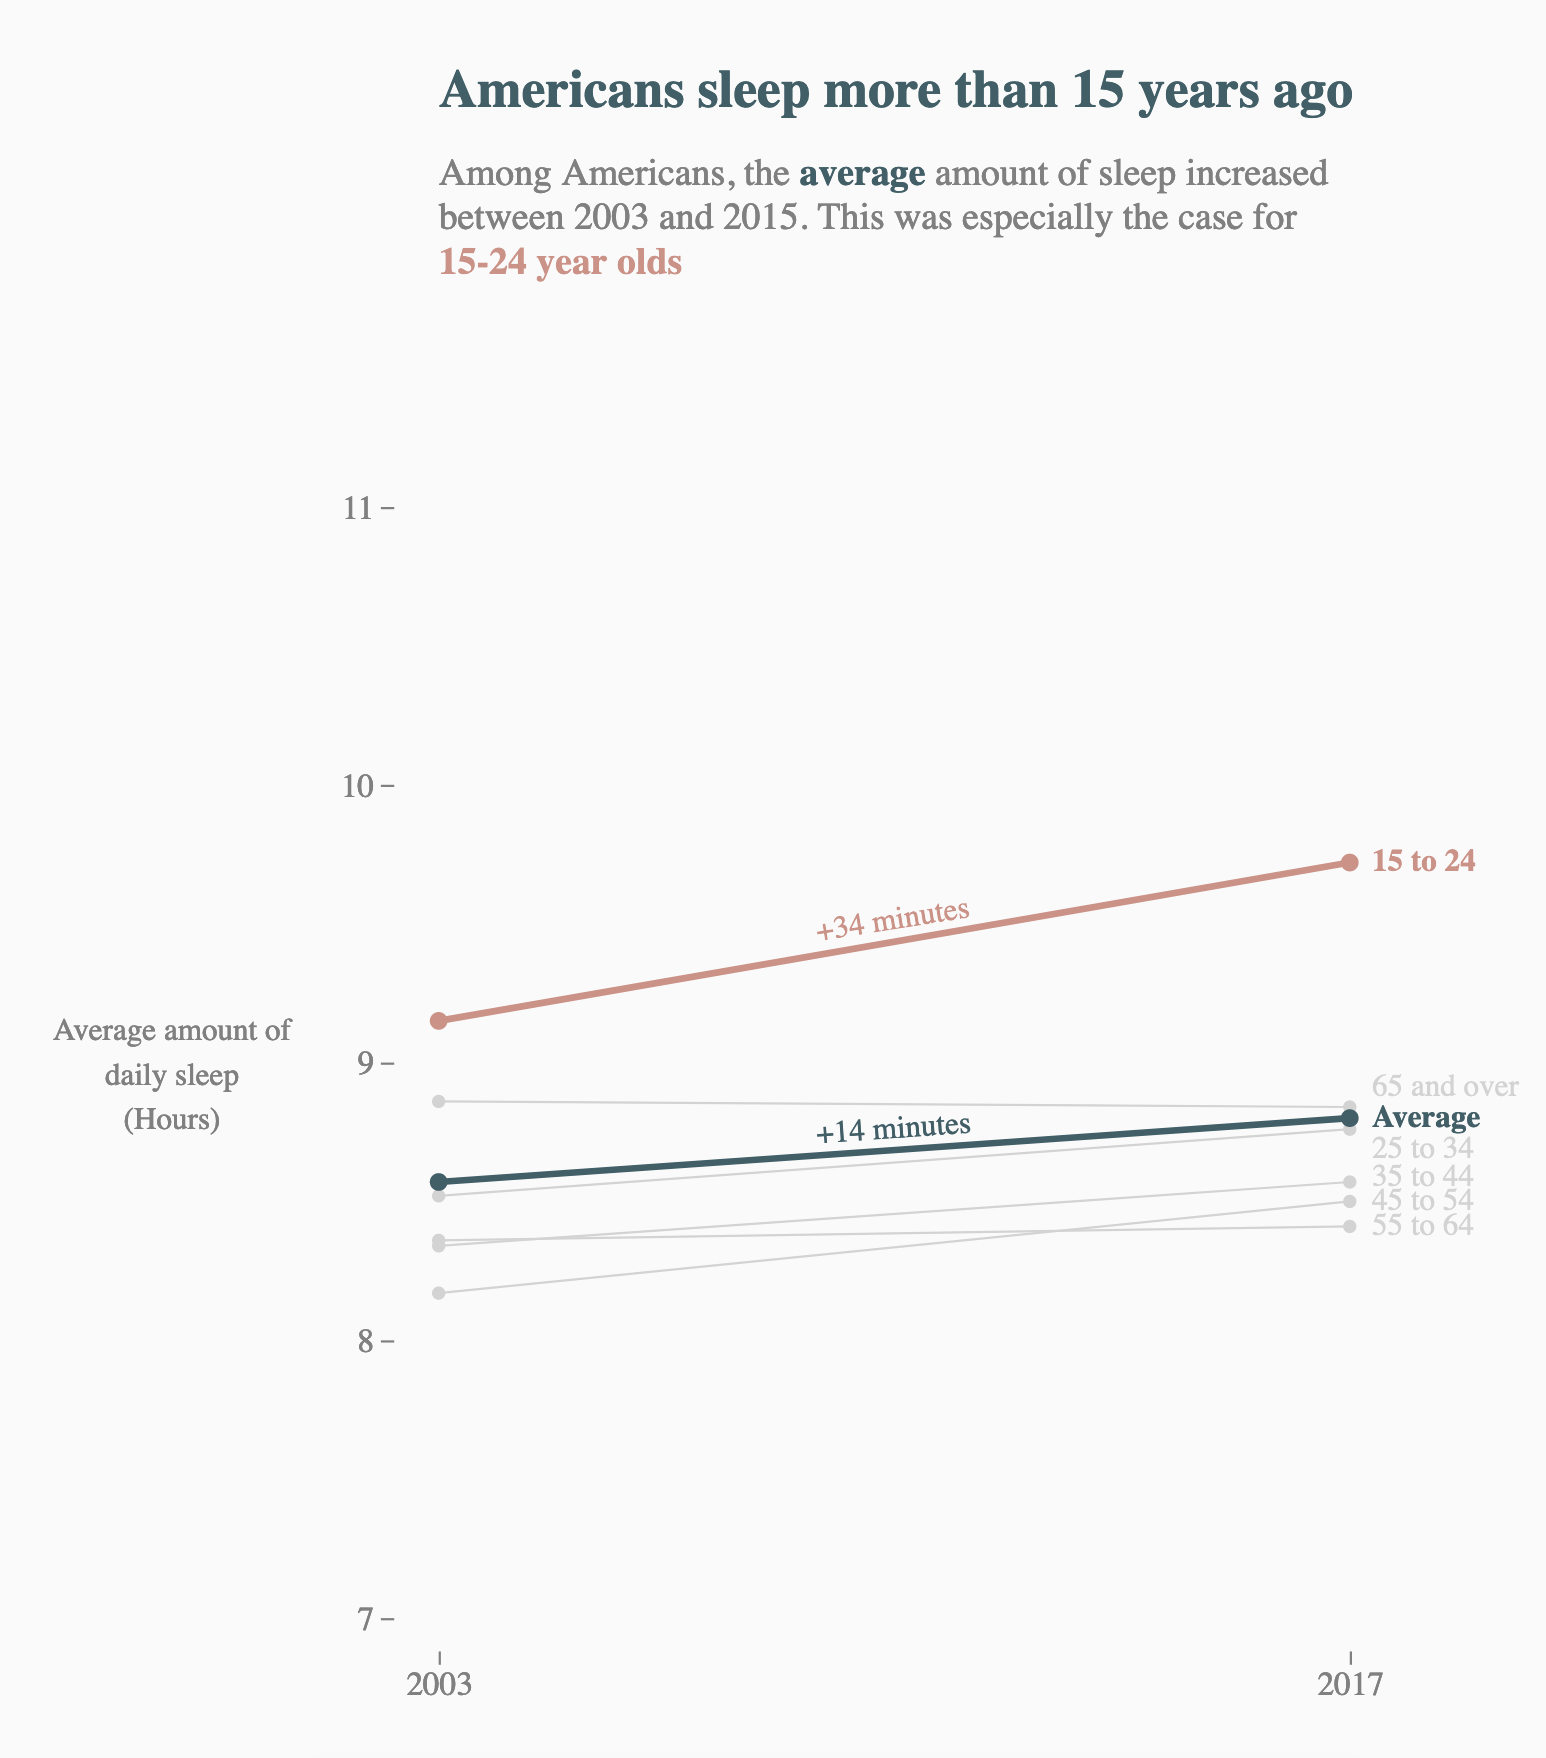
Idiom: Slopegraphs
- Two values
- Data:
- Two quantitative value attributes
- (One derived attribute: change magnitude)
- Mark: point and line
- Line connecting mark between points
- Channels:
- Two vertical points: express attribute value
- (Line width/size, color)
- Task: emphasize changes in rank/value
- Scalability: hundreds of value levels
Idiom: Calendar View
- Data: table (years), one timeline
- Tasks: compare trends (by days of the week, month, year), locate outliers
- Visual representation: shape, vertical/horizontal position, color hue
- Considerations: natural view for humans, focus on common time aggregations

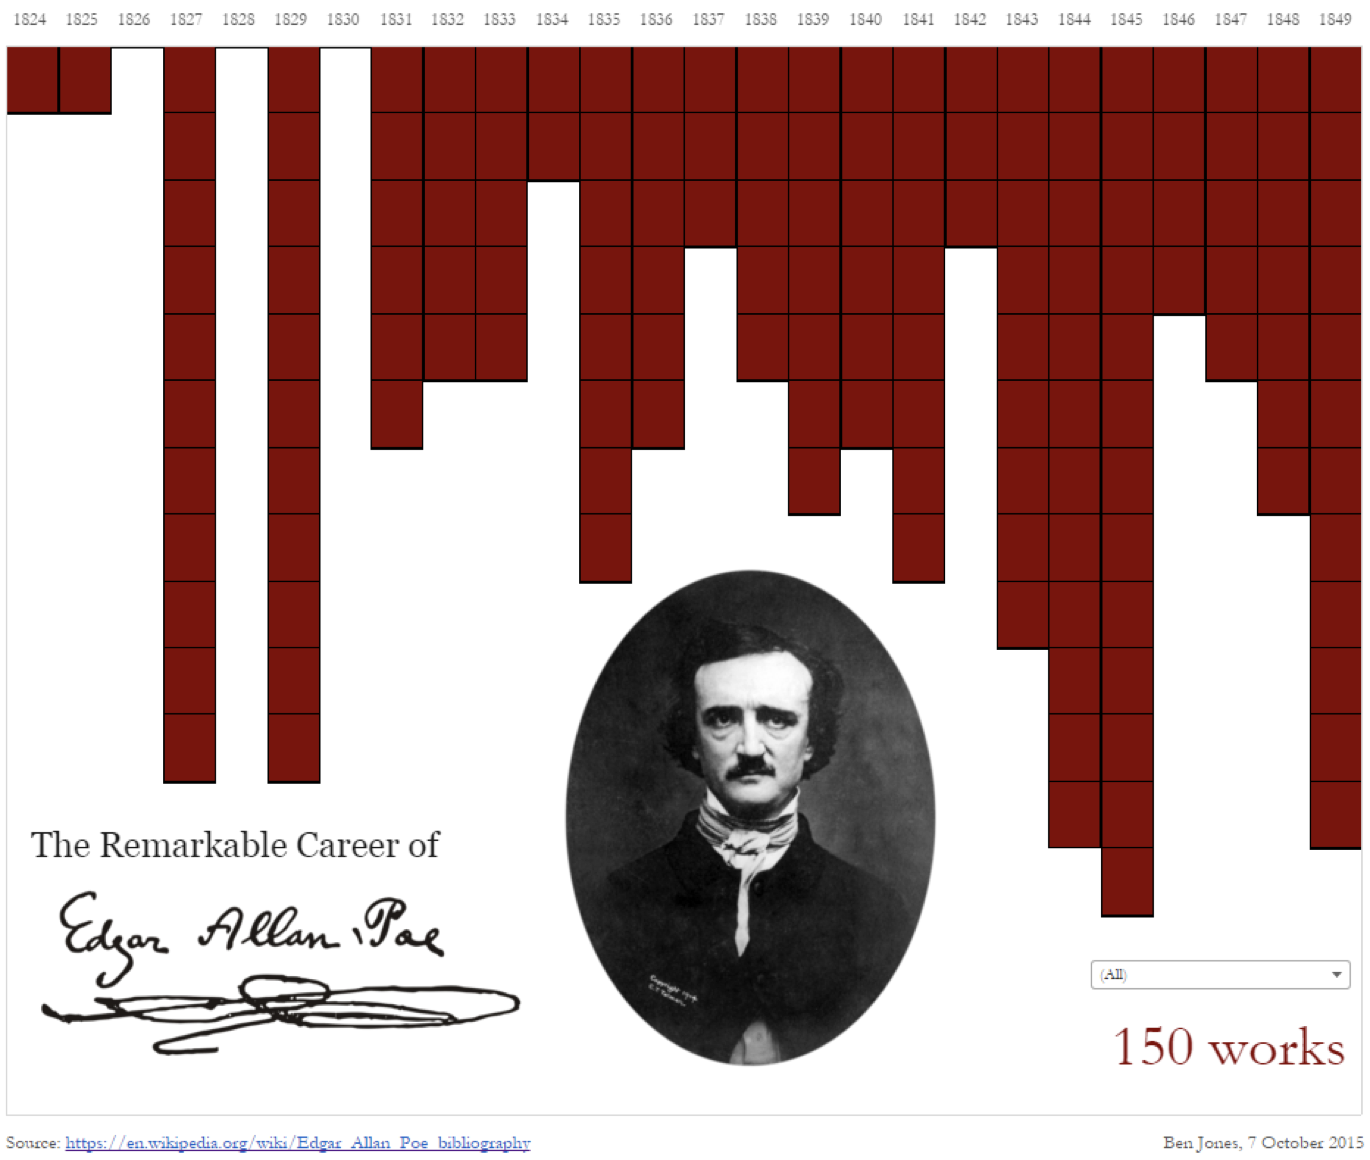
Breaking Conventions
- Presentation vs. exploration
- Engaging/evocative
- Inverted y-axis
- Blood drips down on Poe
[Slide inspired by Ben Jones]
Radial Idioms
Idiom: Radial Timelines
- Data: table (years), one timeline
- Tasks: compare trends (by days of the week, month, year), locate outliers
- Visual representation: line, radial position, color hue (rainbow :( )
- Considerations: appeals to cyclic nature of time

Idiom: Radial Barchart
Modern Representations
Idiom: Horizon Charts
- Data: table, many timelines
- Tasks: compare trends and similarities (with many), locate outliers
- Visual representation: line, vertical position, color luminosity (quant divergent)
- Considerations: uses much less space

Joyplots
Idiom: Connected Scatterplots
- Scatterplot with line connection marks
- Popular in journalism
- Horizontal and vertical axes: value attributes
- Line connection marks: temporal order
- Empirical study
- Engaging, but correlation unclear

Idiom: Connected Scatterplots (cont.)
- Alternative to dual-axis charts
- Horizontal: time
- Vertical: two value attributes

Timelines Revisited
HCIL Research
Time Searcher
Visual Exploration of Time-Series DataLifelines

Lifelines (cont.)
LifeLines for Visualizing Patient RecordsLifelines 2

Similian

LifeFlow

LifeFlow How-To
LifeFlow Demo
EventFlow
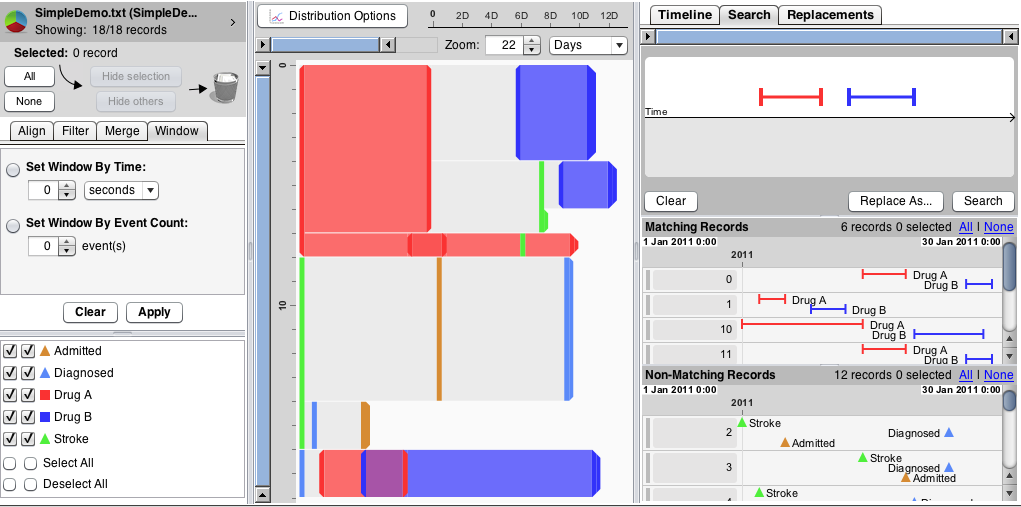
EventFlow Demo
Common Derives/Tricks for Temporal Data
Align by Event
Add/Remove Granularity
Truncate dates
Aggregate by date parts
Window Average/Median
Seasonality
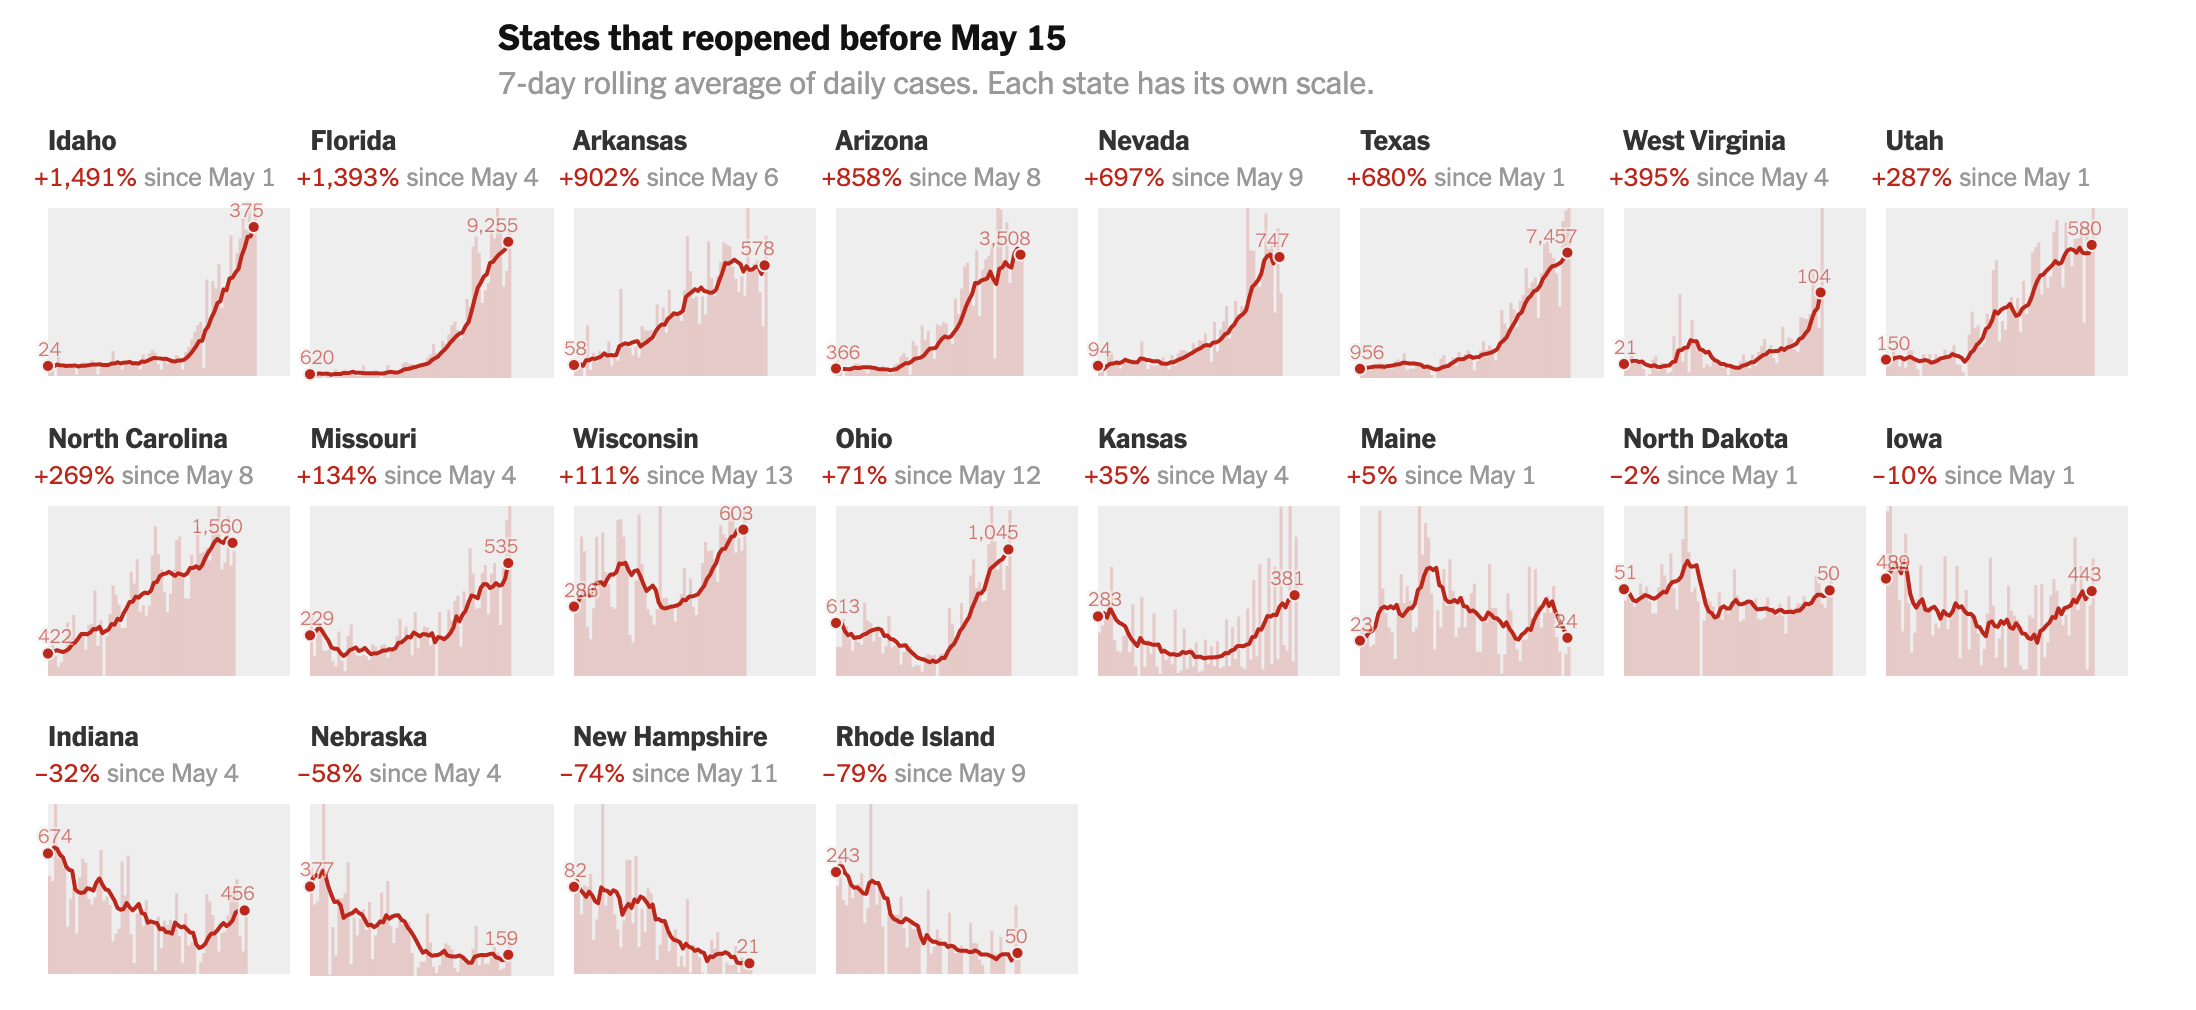
Loose Scales
Interaction network in chi2019Temporal with D3
Multi-Series Line Chart
Multi-Series Line Chartby mbostockStreamgraph
StreamgraphLinechart
Line ChartStacked Area Chart
Stacked Area Chartby mbostockStacked Radial Area
Stacked Radial Areaby mbostockStacked Radial Area (cont.)
Radial Area ChartCalendar View
Calendar Viewby mbostockWhat We Learned
- Line charts
- Area charts
- Other representations
- Radial idioms
- Modern represtations
- HCIL work on temporal
- Tips