Networks and Color
Information Visualization
John Alexis Guerra Gómez | john.guerra[at]gmail.com | @duto_guerra
https://johnguerra.co/lectures/information_visualization_spring2023/08_Networks_and_Trees/
https://johnguerra.co/lectures/information_visualization_spring2023/08_Networks_and_Trees/

Arrange Networks and Trees

What We Are Going to Learn
- How to recognize, create, and store networks
- Network Visualization Techniques
- Node-Link Representations
- Force Simulations
- Matrix Representations
- Working with Color
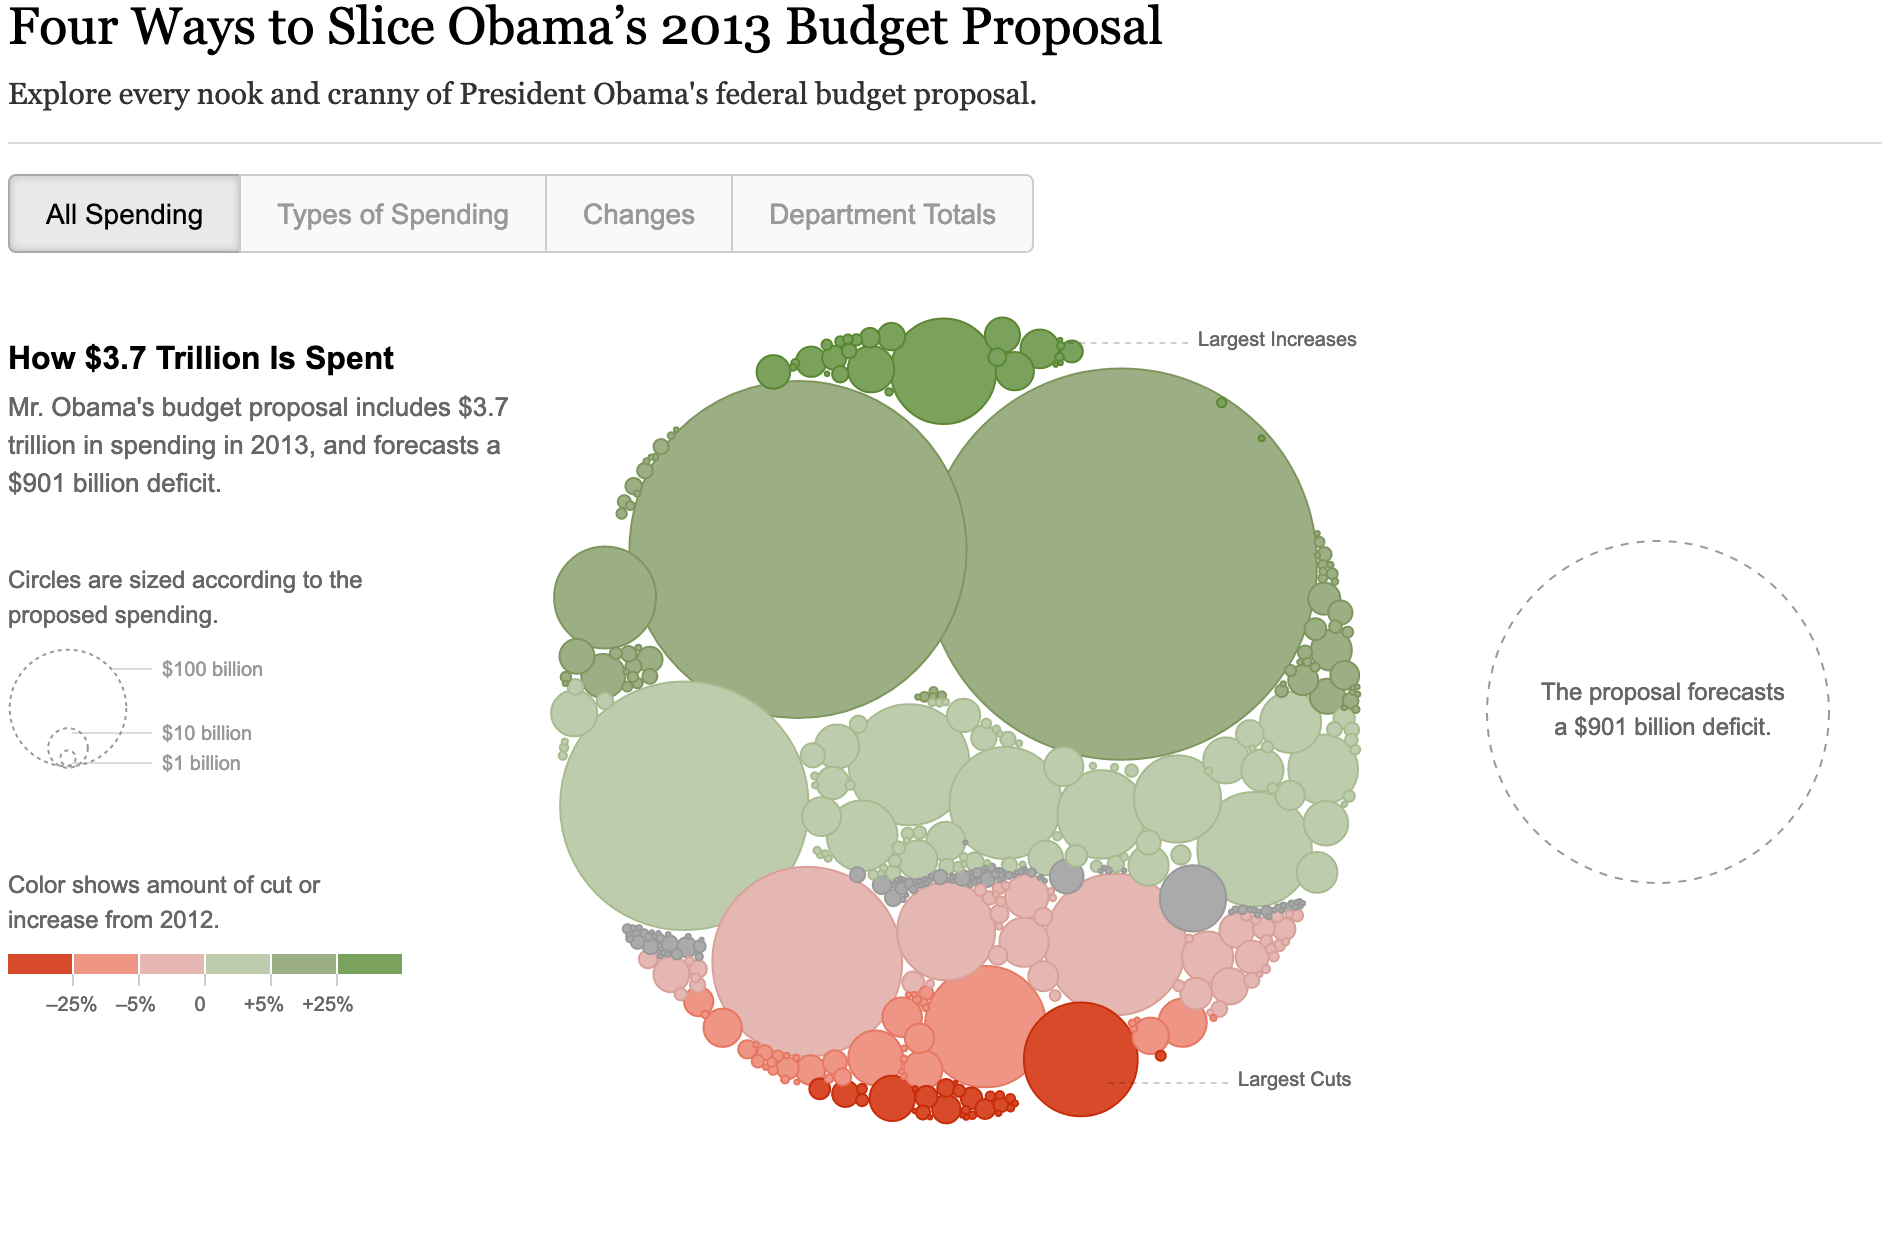
- Sequential: one hue
- Divergent: two hues
- Categorical: Multiple hues
- Continuos multiple hues
Networks: Basics
Define Networks
Networks are defined by two things: nodes and links.
Nodes: a collection of entities which have properties that are somehow related to each other
- E.g., people, forks in rivers, proteins, web pages, organisms, etc.
Edges/Links: connections between nodes
- Links may be directed or undirected
- Links may be binary or weighted
[Slide courtesy of Andy Reagan]
Just Some Examples
- Tournaments
- Organization charts
- Genealogy
- Diagramming (e.g., Visio)
- Biological interactions (genes, proteins)
- Computer networks
- Social networks
- Simulation and modeling
- Integrated circuit design
- River systems
- Many, many more (and some history)
[Slide courtesy of Andy Reagan]
Network values
Nodes
- Usually contains the values
- Friends attributes (name, age, gender, etc) in a social network.
Links
- But links can also have attributes
- When the friendship was stablished
- What type of relationship
- How many friends in common do they have
How to Store Network Data
- Node and link files
- Adjacency matrix
- Nested: XML/JSON
- Many others: list of formats from NetworkX
[Slide courtesy of Andy Reagan]
Node and Link Files

[Slide courtesy of Andy Reagan]
Node and Link Files (cont.)

[Slide courtesy of Andy Reagan]
Adjacency Matrix

[Slide courtesy of Andy Reagan]
Nested: XML/JSON

[Slide courtesy of Andy Reagan]
How to Create Network Data
- Group by common attribute.
- Identify nodes, extract links.
[Slide courtesy of Andy Reagan]
From Flat Data
Say we have tabular data for Les Miserables with columns for "scene", "character", and "line". We want to examine the network of which characters co-occur in scenes. Take all unique characters are nodes and link between all characters in a scene together.
- JS:
d3.nest().key(function(d) { return d.scene; }). - Python:
pd.groupby('scene').
[Slide courtesy of Andy Reagan]
Identify Nodes, Extract Links
Social network data extract
- Loop through all of the messages.
- Add to a list of all users.
- Add to an edge list that has all "mentions" of another user.
[Slide courtesy of Andy Reagan]
e.g. Co-authorship networks
https://observablehq.com/@john-guerra/uist-2020-co-authorship-networkNetworks: Force Simulations
Idiom: Force-Directed Placement
- Visual encoding:
- Link connection marks, node point marks
- Tasks:
- Explore topology; locate paths, clusters
- Scalability:
- Node/edge density E < 4N
- Considerations:
- Spatial position no meaning directly encoded
- Proximity semantics?
Force simulation explained
Force in a Box
Use the Force!
Beeswarm Plot
Collision Detection
D3 Force in the wild
Matrix Representations
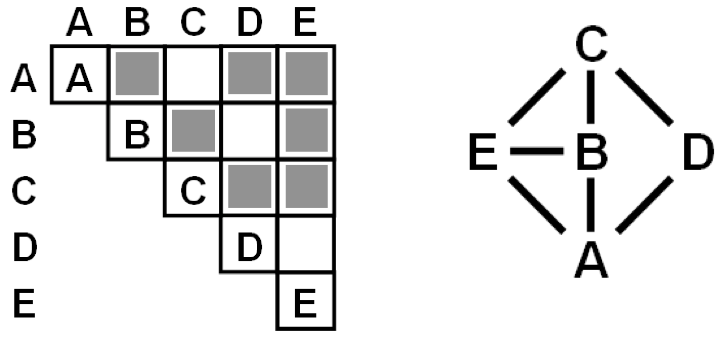
Idiom: Adjacency Matrix View
- Data: network
- Transform into same data/encoding as heatmap
- Derived data: table from network
- One quantitative attribute
- Weighted edge between nodes
- Two categorical attributes: node list x 2
- One quantitative attribute
- Visual encoding:
- Cell shows presence/absence of edge
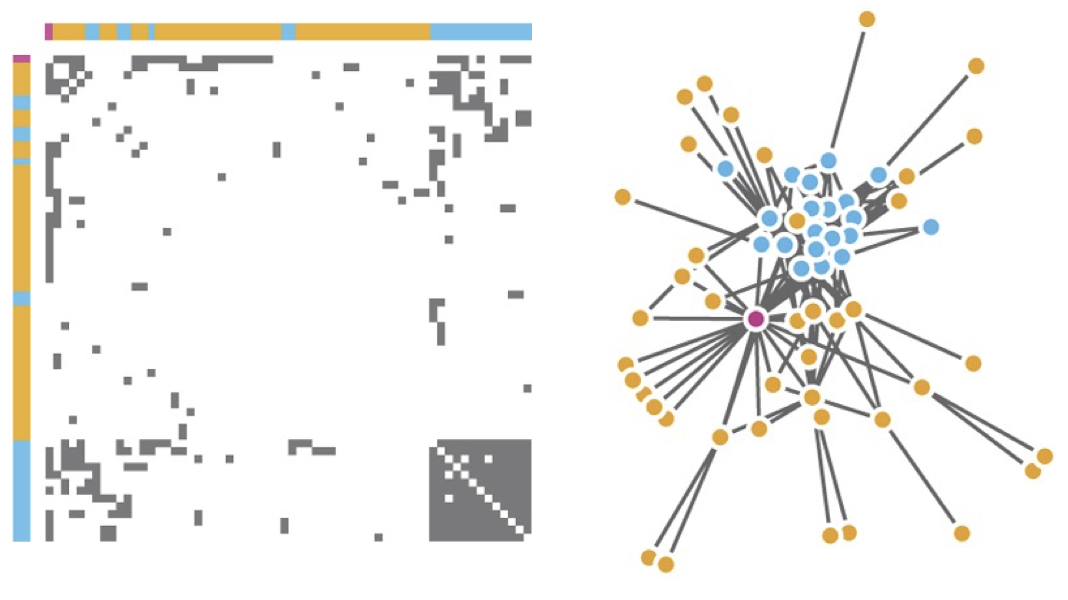
- Tasks:
- Identify clusters (topology)
- Summarize topology/distribution
- Scalability:
- 1,000 nodes, one million edges
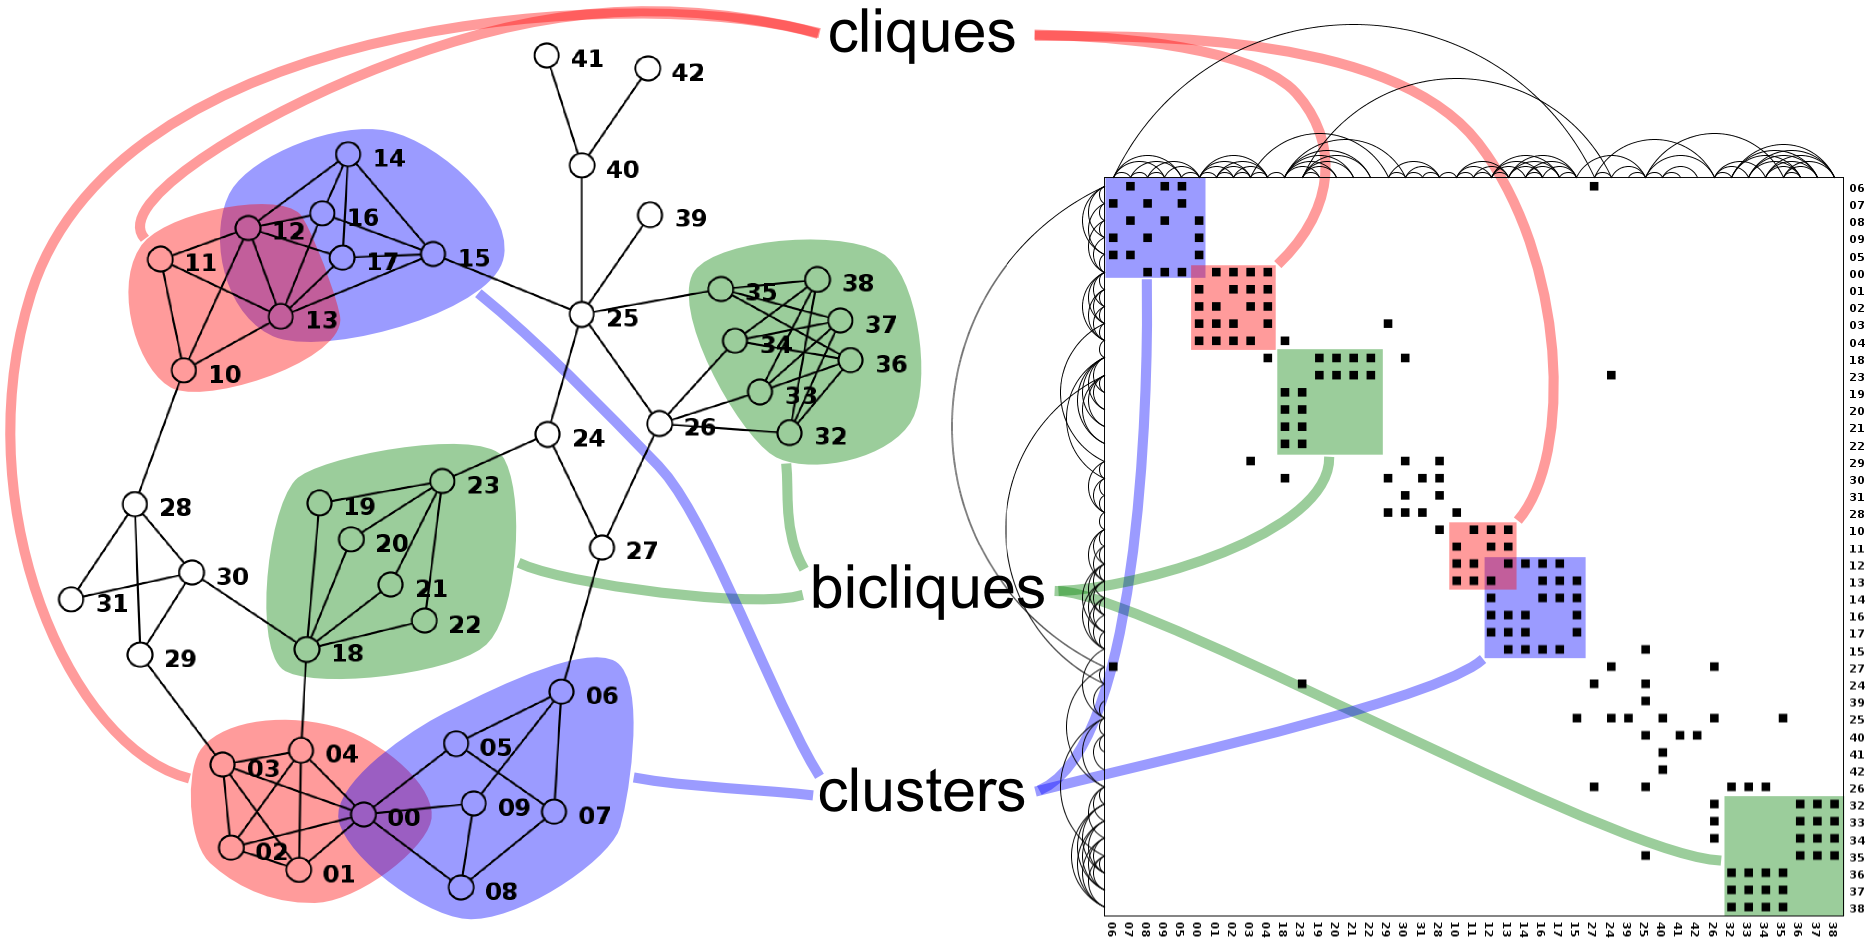
Connection vs. Adjacency Comparison
- Adjacency matrix strengths:
- Predictability, scalability, supports reordering
- Some topology tasks trainable
- Node-link diagram strengths:
- Topology understanding, path tracing
- Intuitive, no training needed
- Empirical study:
- Node-link best for small networks
- Matrix best for large networks...
- ...if tasks don’t involve topological structure!

Vega-Lite-API Matrix
e.g. CS Faculty network
Networks: Other Idioms
Chord Diagram
- Data: networks (small number of nodes)
- Tasks: summarize connections; identify highest degree
- Considerations: usually good for origin to destination
Edge Bundling
- Data: networks
- Tasks: summarize common connections
- Considerations:
- Reduces cluttering
- Requires computing time
- Works with any link based idiom

Arc Diagram
- Data: networks (few nodes)
- Tasks: summarize common connections.
- Considerations:
- Nodes' order matters.
- Better with highly clustered data

Hive Plots
Semantic Substrates
- Data: networks with many edges
- Task: summarize distribution of non network attribs
- Considerations:
- Easier to understand
- Scale well
- Edges on demand work best


Idiom: Sankey Diagram
- Good for depicting flow
- Not that well-known
Idiom: Parallel Sets
Metrics and Statistics
Simple Stuff
- Number of nodes, number of edges
- Connected components: count of separate groups of nodes
- Graph density: percent of possible links that are present

Degree Distribution
- E.g., run “Average Degree” tab in Gephi
- For pure random networks: $P_k = e ^ { \langle k \rangle } \frac{ \langle k \rangle ^k}{k!}$
- For preferential attachment: $P_k ~\sim~ k ^ {-\gamma}$

Path Length
- E.g., run “Average Path Length” in Gephi
- The path length between nodes i and j defined as $d_{ij}$
- Average path length $\langle d_{ij} \rangle$
- Network diameter $d_\max = \max _{i,j} d_{ij}$

Centrality
- Betweenness centrality: number of shortest paths across node
- Degree centrality (node degree), also edge centrality (not in Gephi, use NetworkX)
- Eigenvector centrality $Ax = \lambda x$
- Closeness $d_{cl} = \left [ \sum _{ij} d_{ij} ^ {-1} / n \choose 2 \right ] ^ {-1}$

More Centrality
- PageRank, like eigenvector centrality, can be written as an eigenvalue problem: $$PR(p_i) = \frac{1-d}{N} + \sum _{p_j} \frac{PR(p_j)}{L(p_j)}$$
Clustering
- Watts and Strogatz measure: $$ C_1 = \left \langle \frac{\sum_{j_1,j_2\in N} a_{j_1j_2}}{k_i(k_i-1)/2} \right \rangle $$
- Newman (and Gephi): $$ C_2 = \frac{3 \times \textrm{triangles}}{\textrm{triples}} $$

Modularity and Structure

Color
Encode, Map, Color

Categorical Color

Decomposing Color
- First rule: do not talk about color!
- Color is confusing if treated as monolithic
- Decompose into three channels
- Ordered can show magnitude
- Luminance: how bright
- Saturation: how colorful
- Categorical can show identity
- Hue: what color
- Channels have different properties
- What they convey directly to perceptual system
- How much they can convey: how many discriminable bins can we use?

Spectral Sensitivity

Luminance
- Need luminance for edge detection
- Fine-grained detail only visible through luminance contrast
- Legible text requires luminance contrast!
- Intrinsic perceptual ordering

Color Spaces

Designing for Color Deficiency: Check with Simulator

Designing for Color Deficiency: Avoid Encoding by Hue Alone
- Redundantly encode.
- Vary luminance.
- Change shape.

Color Deficiency: Reduces Color to Two Dimensions

Designing for Color Deficiency: Blue-Orange is Safe

Bezold Effect: Outlines Matter

Relative Judgments: Color and Illumination

Relative Judgments: Color and Illumination (cont.)

Categorical Color: Limited Number of Discriminable Bins
- Human perception built on relative comparisons
- Great if color is contiguous
- Suprisingly bad for absolute comparisons
- Noncontiguous small regions of color
- Fewer bins than you want
- Rule of thumb: 6-12 bins, including background and highlights

Glyphs
- Glyphs: composite objects
- Internal structure with multiple marks
- Alternative to color encoding
- Or coding with any single channel

ColorBrewer

Ordered Color
Ordered Color: Rainbow is Poor Default
- Problems:
- Perceptually unordered
- Perceptually nonlinear
- Benefits:
- Fine-grained structure visible and nameable
- Alternative:
- Large-scale structure: fewer hues
- Fine structure: multiple hues with monotonically increasing luminance (vs. Viridis R/Python)

Viridis
Colorful, perceptually uniform, colorblind-safe, monotonically-increasing luminance

Colormaps


Map Other Channels

Angle

What We Learned
- How to recognize, create, and store networks
- Network Visualization Techniques
- Node-Link Representations
- Force Simulations
- Matrix Representations
- Working with Color
- Sequential: one hue
- Divergent: two hues
- Categorical: Multiple hues
- Continuos multiple hues