ISIS-3710 Dataviz Intro

jguerra[at}northeastern.edu | @duto_guerra
Slides:http://johnguerra.co/lectures/webDevelopment_spring2025/12_DataViz_Intro/
Class page:http://johnguerra.co/classes/webDevelopment_spring_2025/
Information Visualization
Defining Visualization (vis)
Computer-based visualization systems provide visual representations of datasets designed to help people carry out tasks more effectively.
Why?
Have the human in the loop
Visualization is suitable when there is a need to augment human capabilities rather than replace people with computational decision-making methods.
Why show data in detail?
- Summaries lose information
- Confirm expected and find unexpected patterns
- Assess validity of statistical model
Anscombe's quartet
| I | II | III | IV | ||||
|---|---|---|---|---|---|---|---|
| x | y | x | y | x | y | x | y |
| 10.0 | 8.04 | 10.0 | 9.14 | 10.0 | 7.46 | 8.0 | 6.58 |
| 8.0 | 6.95 | 8.0 | 8.14 | 8.0 | 6.77 | 8.0 | 5.76 |
| 13.0 | 7.58 | 13.0 | 8.74 | 13.0 | 12.74 | 8.0 | 7.71 |
| 9.0 | 8.81 | 9.0 | 8.77 | 9.0 | 7.11 | 8.0 | 8.84 |
| 11.0 | 8.33 | 11.0 | 9.26 | 11.0 | 7.81 | 8.0 | 8.47 |
| 14.0 | 9.96 | 14.0 | 8.10 | 14.0 | 8.84 | 8.0 | 7.04 |
| 6.0 | 7.24 | 6.0 | 6.13 | 6.0 | 6.08 | 8.0 | 5.25 |
| 4.0 | 4.26 | 4.0 | 3.10 | 4.0 | 5.39 | 19.0 | 12.50 |
| 12.0 | 10.84 | 12.0 | 9.13 | 12.0 | 8.15 | 8.0 | 5.56 |
| 7.0 | 4.82 | 7.0 | 7.26 | 7.0 | 6.42 | 8.0 | 7.91 |
| 5.0 | 5.68 | 5.0 | 4.74 | 5.0 | 5.73 | 8.0 | 6.89 |
| Property | Value |
|---|---|
| Mean of x | 9 |
| Variance of x | 11 |
| Mean of y | 7.50 |
| Variance of y | 4.125 |
| Correlation between x and y | 0.816 |
| Linear regression | y = 3.00 + 0.500x |
| Coefficient of determination of the linear regression | 0.67 |
Anscombe's visualized

More examples same stats
 https://dabblingwithdata.wordpress.com/2017/05/03/the-datasaurus-a-monstrous-anscombe-for-the-21st-century/
Datasaurus!
 https://dabblingwithdata.wordpress.com/2017/05/03/the-datasaurus-a-monstrous-anscombe-for-the-21st-century/
Visual Analytics
How to do data analytics?
- Statistical Analysis
- Machine Learning and Artificial Intelligence
- Visual Analytics (and data analytics)
Data Mining/Machine Learning

Information Visualization

Visual Analytics

Traditional
Pros:
Cons:
|
Data Mining/ML
Pros:
Cons:
|
InfoVis
Pros:
Cons
|
In Infovis we look for insights
- Deep understanding
- Meaningful
- Non obvious
- Actionable
Insights
Health insurance claims
Task: Detect fraud network clusters
User: Undisclosed Analysts

Overview

Ego distance

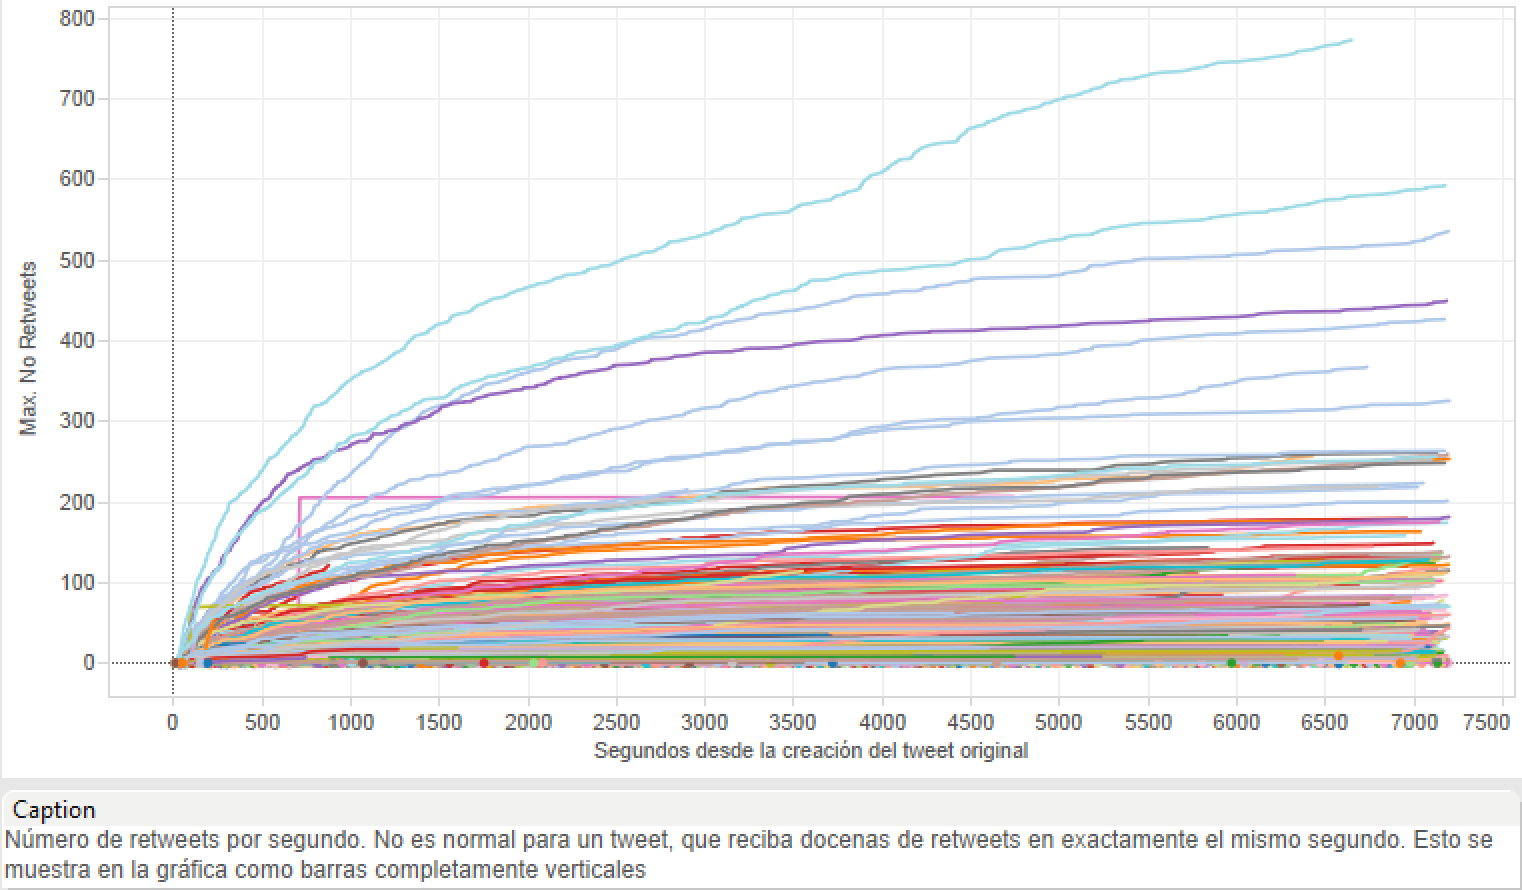
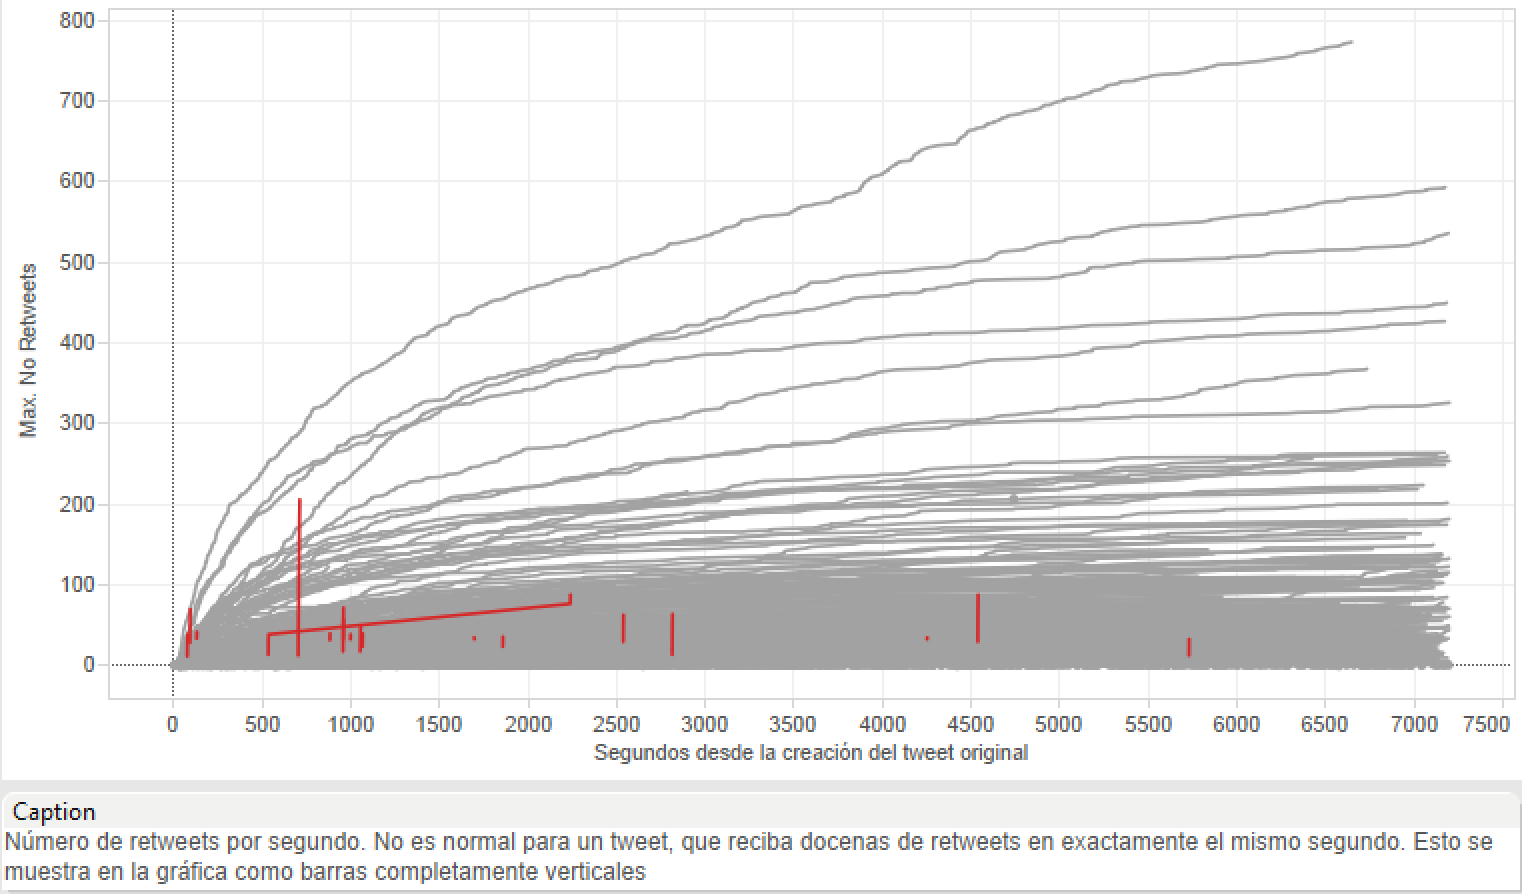
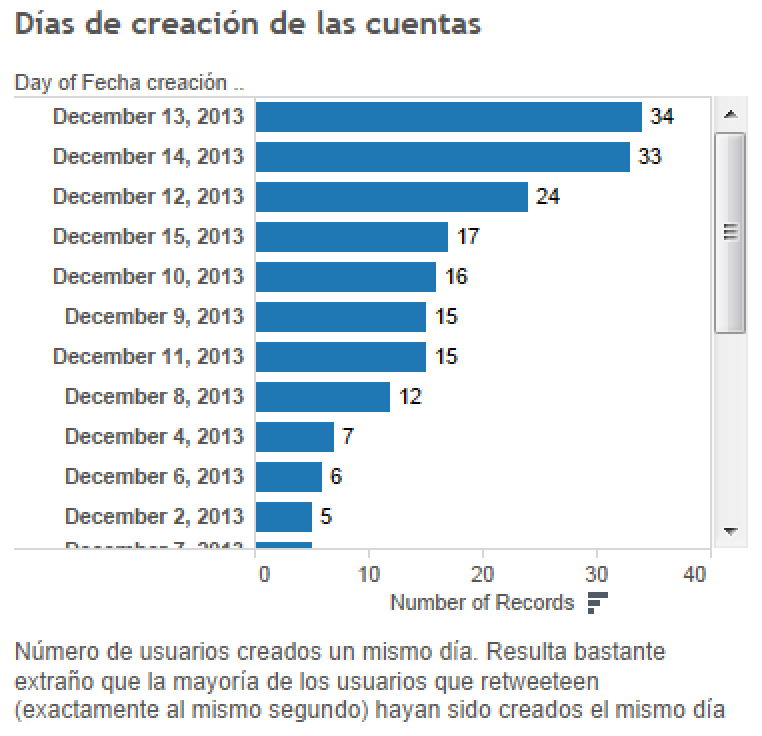
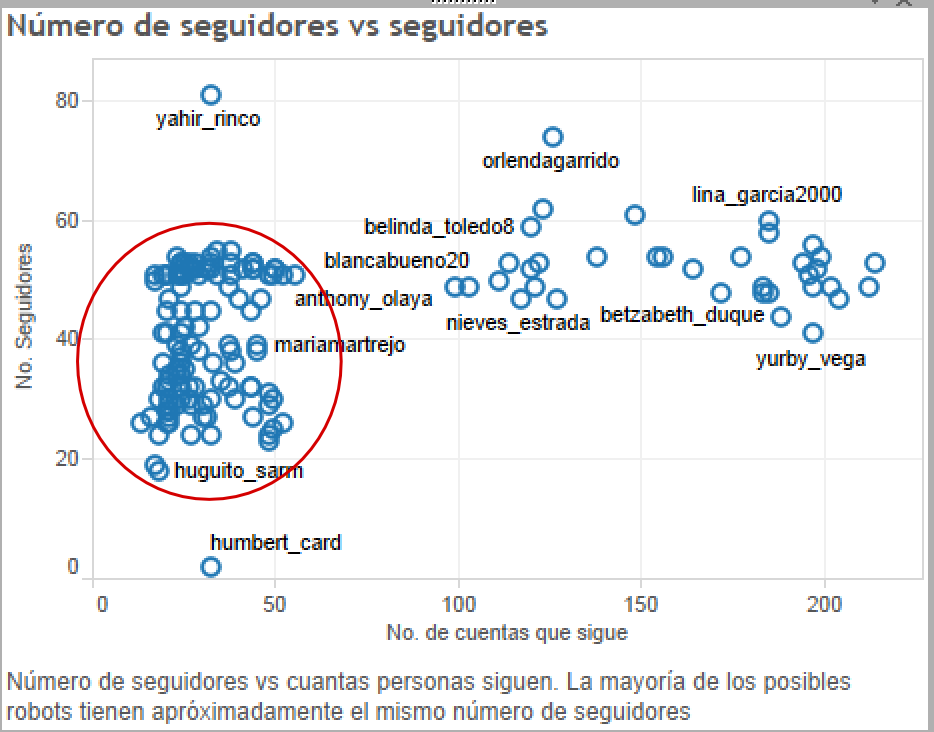
Tweetometro
Task: Twitter behavior during Presidential Elections
User: Me
Normal tweets

Weird tweets?

Creation dates

Number of followers

What car to buy?
Task: What's the best car to buy?
User: Me
Normal procedure
Ask friends and family
Problem
That's inferring statistics from a sample n=1
Better approach
Data based decisions
 http://tucarro.com
Visualization Basics
Types of Visualization
- Infographics
- Scientific Visualization (sciviz)
- Information Visualization (infovis, datavis)
Infographics

Scientific Visualization
- Inherently spatial
- 2D and 3D

Information Visualization

Infovis Basics
Visualization Mantra
- Overview first
- Zoom and Filter
- Details on Demand
Data Types
| 1-D Linear | Document Lens, SeeSoft, Info Mural |
| 2-D Map | GIS, ArcView, PageMaker, Medical imagery |
| 3-D World | CAD, Medical, Molecules, Architecture |
| Multi-Var | Spotfire, Tableau, GGobi, TableLens, ParCoords, |
| Temporal | LifeLines, TimeSearcher, Palantir, DataMontage, LifeFlow |
| Tree | Cone/Cam/Hyperbolic, SpaceTree, Treemap, Treeversity |
| Network | Gephi, NodeXL, Sigmajs |
Perception Preference
Adapted from from:Tamara Munzner Book Chapter