Visualizing Multivariate Data
Arranging Tables
John Alexis Guerra Gómez| ja.guerrag[at]uniandes.edu.co| @duto_guerra
Jose Tiberio Hernández | jhernand[at]uniandes.edu.co
Universidad de los Andes
http://johnguerra.co/lectures/visualAnalytics_fall2019/05_Multivariate_data/
Based onslides from Tamara Munzner
Project description
Recap
Arranging tables
Why Arrange
Space is the most important channel
How to arrange?
- Quantitative data -> Express
- Categorical data -> Separate, Order, Align
Scatterplot
https://observablehq.com/@john-guerra/scatterplotBarchart
http://blockbuilder.org/mbostock/3885304Stacked barchart
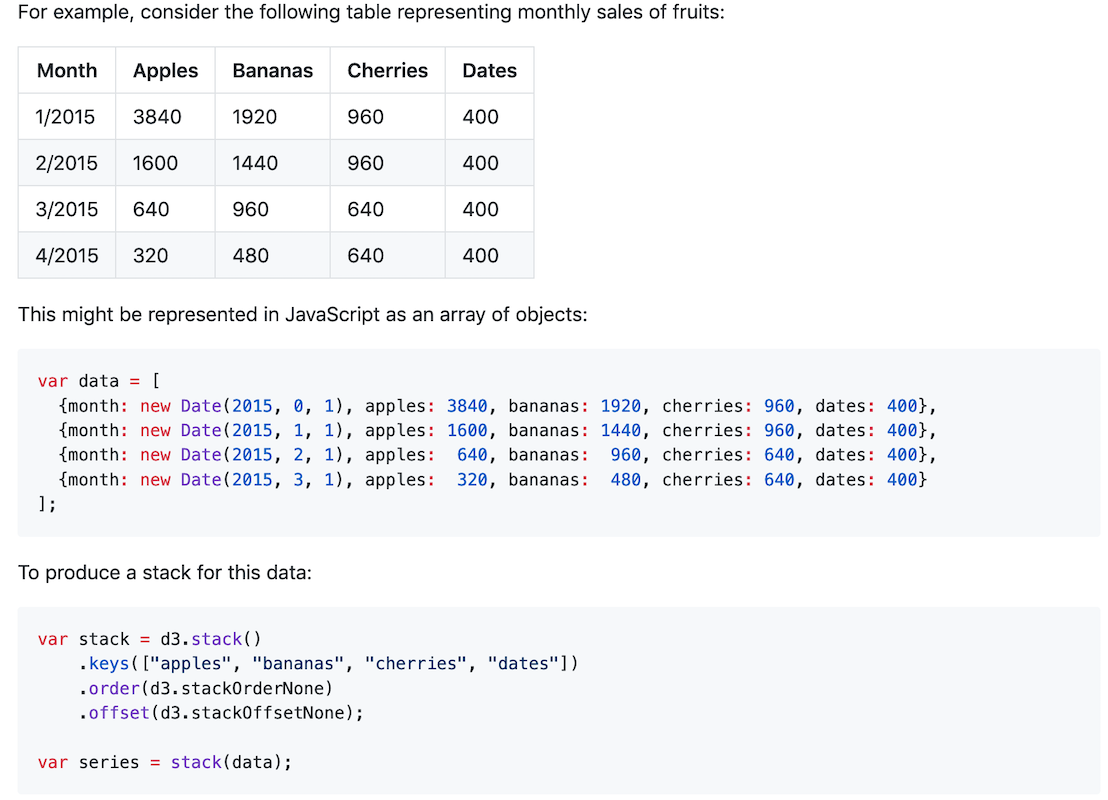
http://blockbuilder.org/mbostock/3886208d3.stack and d3.nest
https://observablehq.com/@john-guerra/d3-stack-with-d3-nestd3 stack
https://github.com/d3/d3-shape/blob/v1.3.5/README.md#stack
stacked to grouped
https://observablehq.com/@d3/stacked-to-grouped-barsInteresting discussion.
Stacked bar charts are the worst.
Robert Kosara's blogMake sure to read the comments
Streamgraph
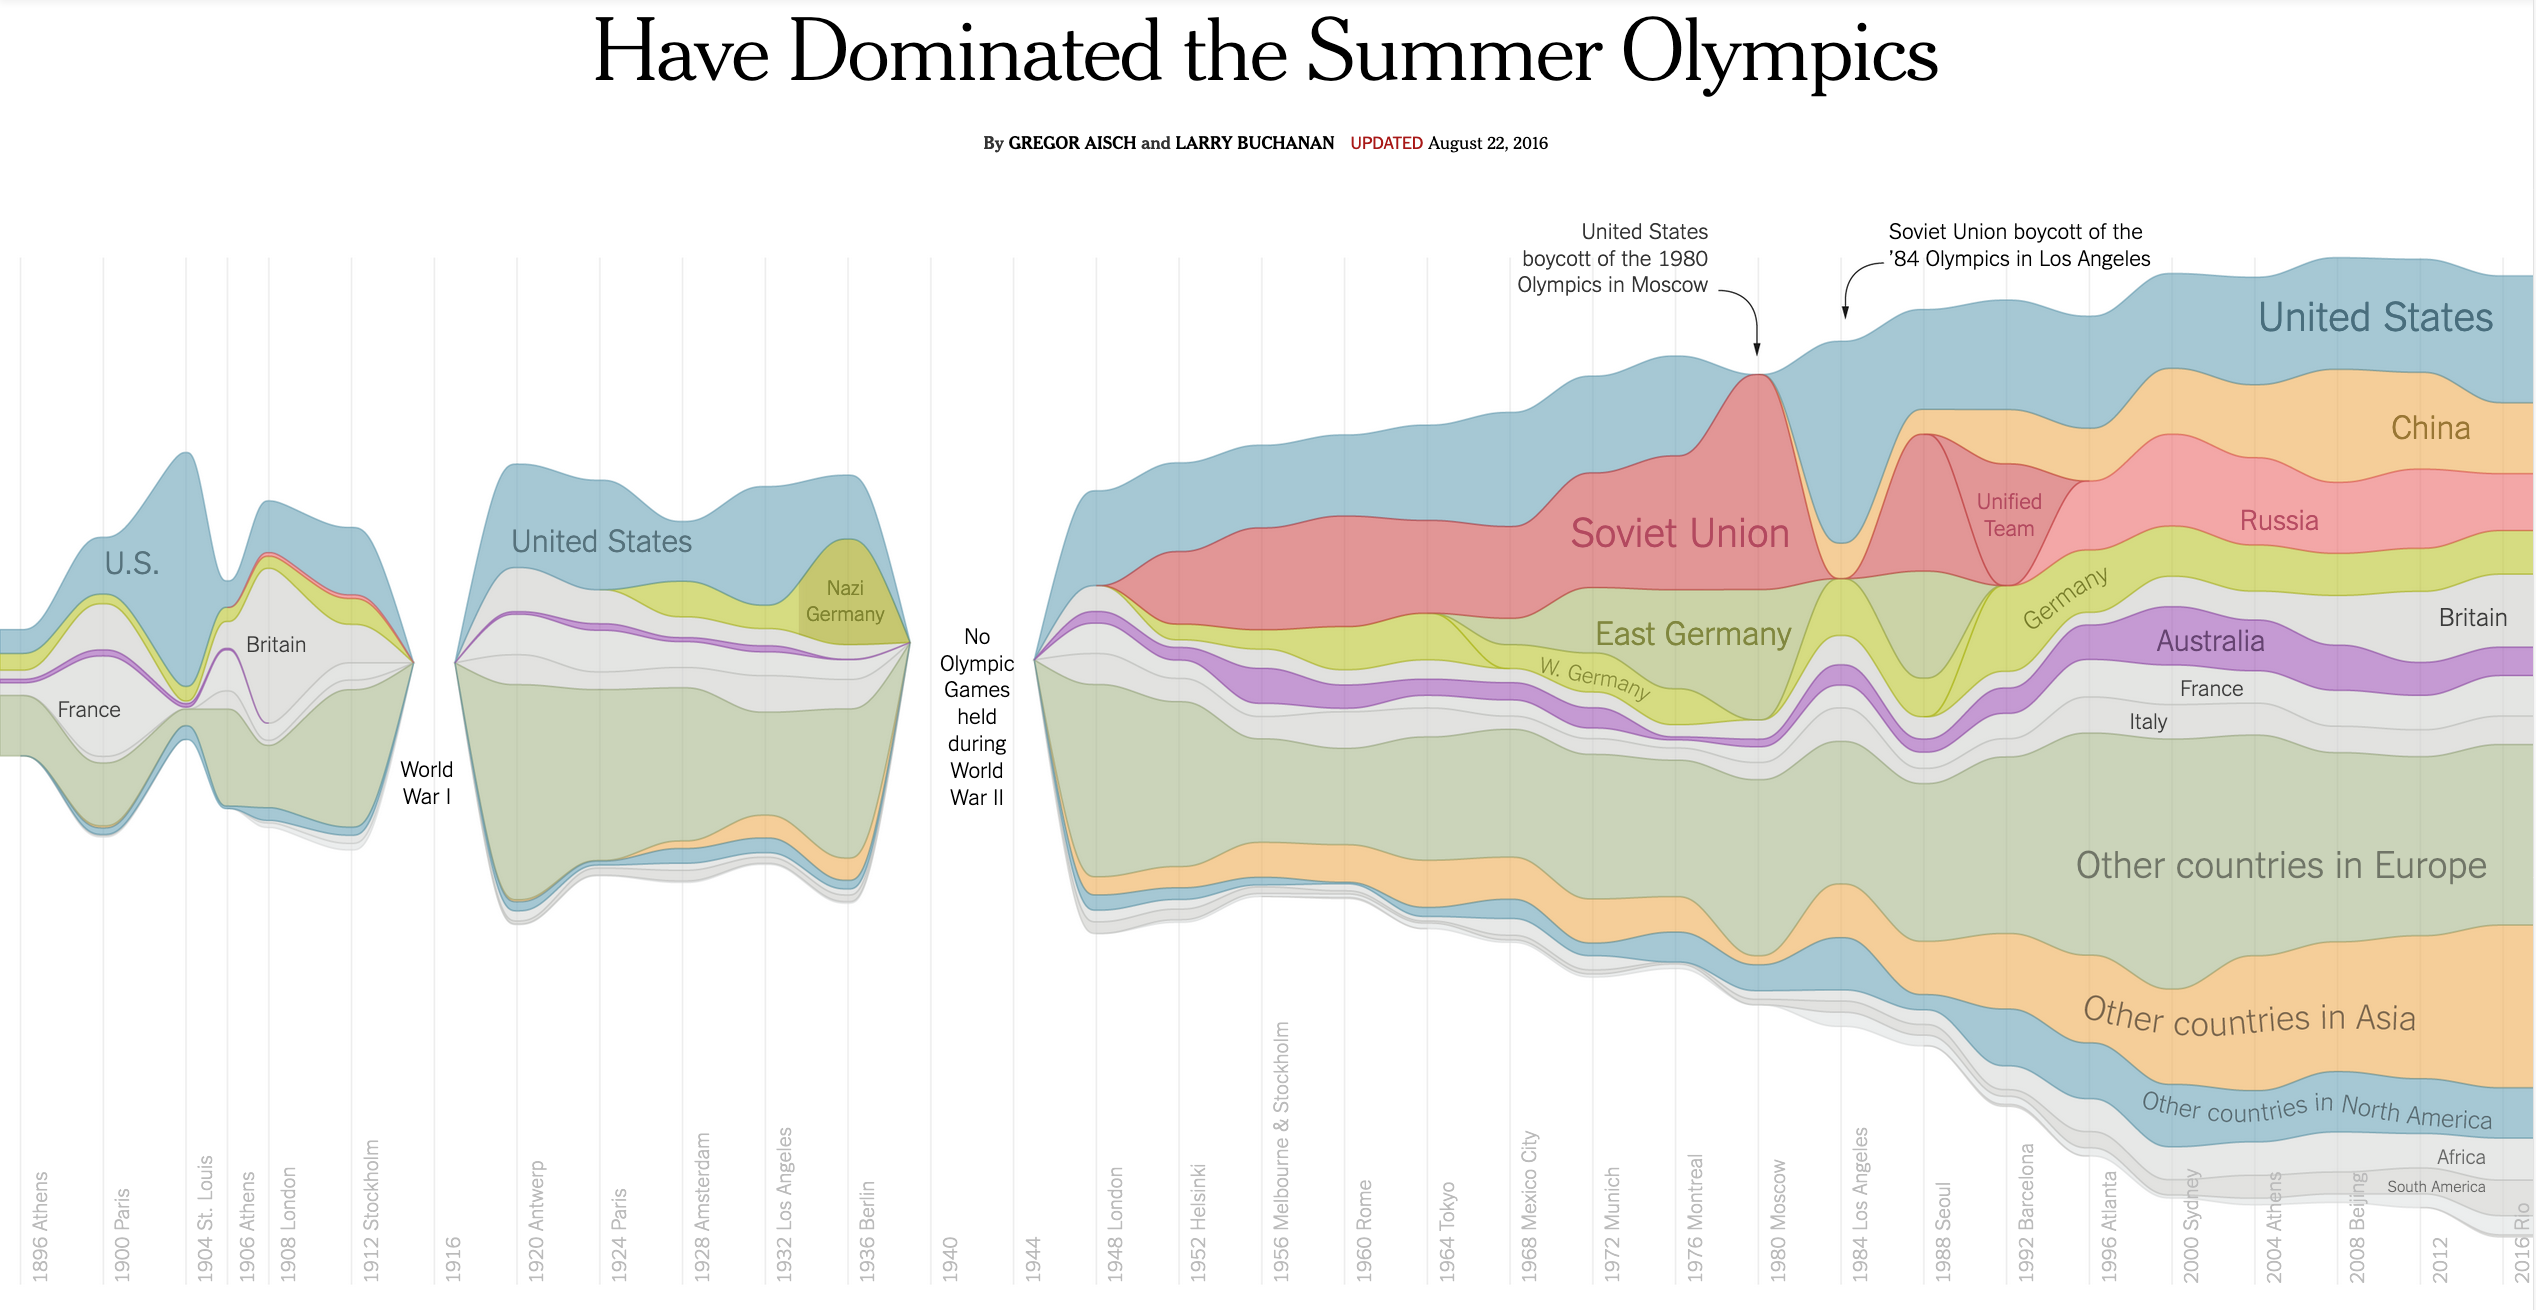
http://blockbuilder.org/mbostock/4060954Streamgraph RIO2016
 http://www.nytimes.com/interactive/2016/08/08/sports/olympics/history-olympic-dominance-charts.html?_r=0
Linechart
http://blockbuilder.org/mbostock/3883245Heatmap
http://blockbuilder.org/ianyfchang/8119685Scatterplot Matrix
http://blockbuilder.org/mbostock/4063663Bonus: InMens
What about millions of points?
http://vis.stanford.edu/projects/immens/demo/splom/Parallel Coordinates
http://blockbuilder.org/syntagmatic/3150059Navio
https://navio.devPolar Area Chart
http://blockbuilder.org/curran/94f1376b946c9d217014Pie chart
http://blockbuilder.org/mbostock/3887235Donut chart
http://blockbuilder.org/mbostock/1346410Stacked bar chart normalized
http://blockbuilder.org/mbostock/3886394Glyphmap
http://blockbuilder.org/sxywu/8d1b563586bf411383345e95a3418715MLExplore.js
Dimmensionality Reduction + Clustering

Fabian Peña