Beyond the Photo Stream
Visual Analytics techniques for navigating, browsing and summarizing large photo repositories
John Alexis Guerra Gómez
@duto_guerra
http://johnguerra.co/slides/beyondPhotoStream

Data ¡GRANDE!
Making sense
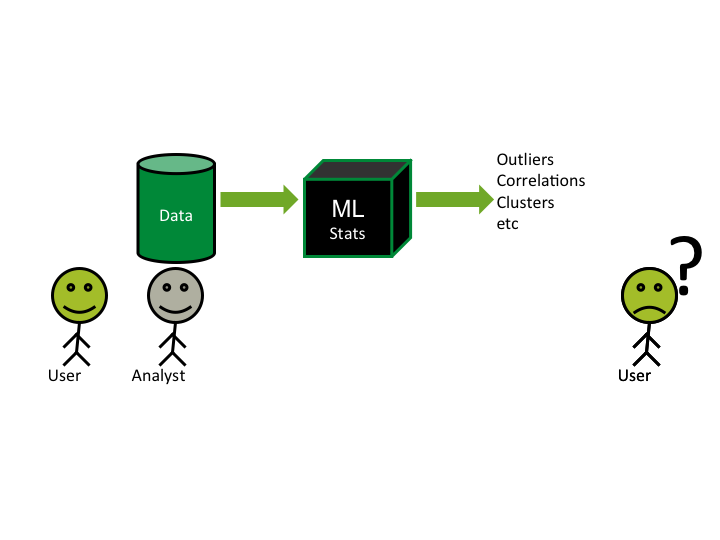
How to make sense of it?
- Statistical Analysis
- Machine Learning and Artificial Intelligence
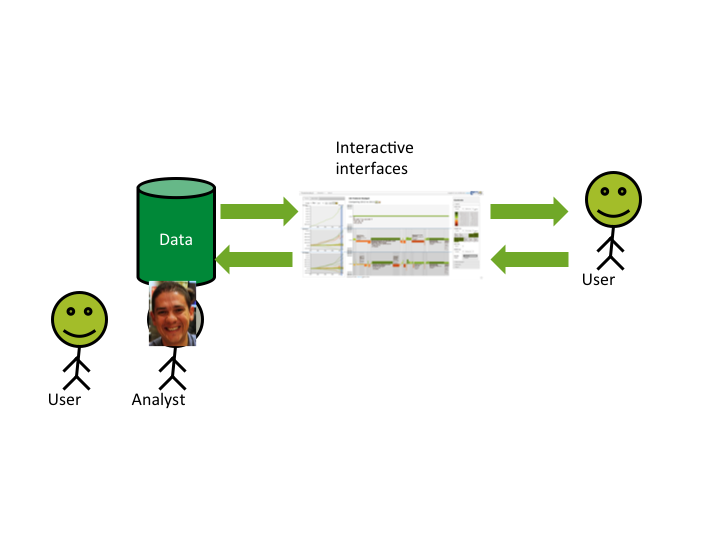
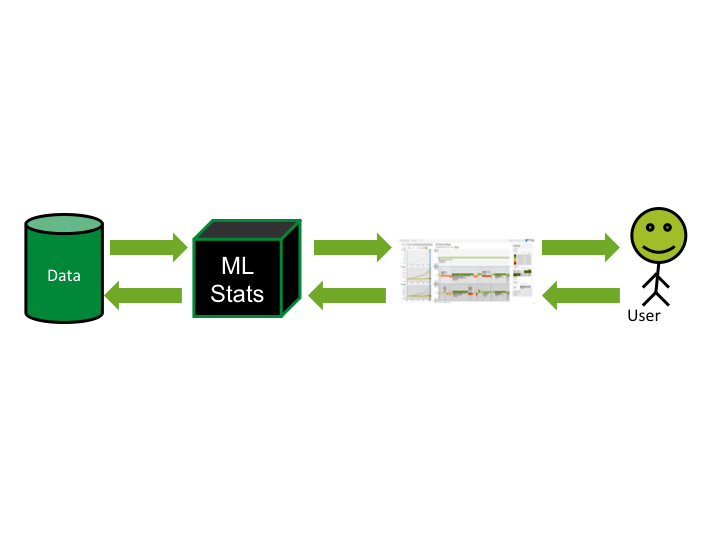
- Visual Analytics (and data analytics)
Data Mining/Machine Learning
Information Visualization
Infovis + Algorithms
Traditional
Pros:
Cons:
|
Data Mining/ML
Pros:
Cons:
|
InfoVis
Pros:
Cons
|
Why should we visualize?
Anscombe's quartet
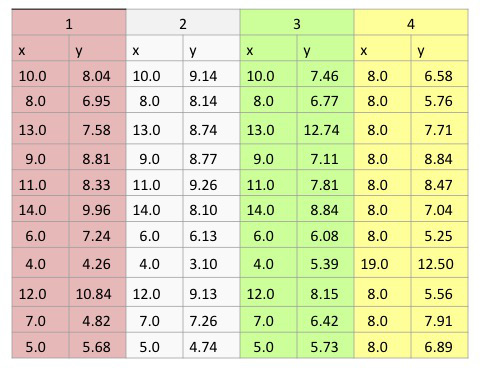
Anscombe's quartet
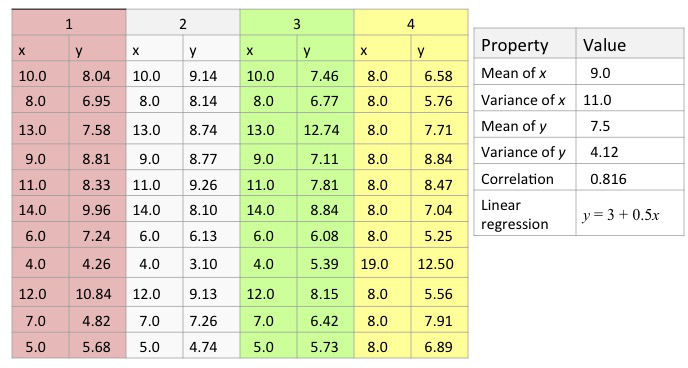
Anscombe's visualized
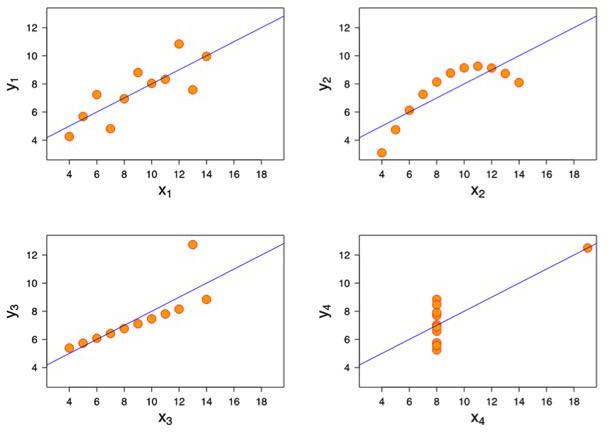
Beyond Anscombe's
 https://www.autodeskresearch.com/publications/samestats
In Infovis we look for Insights
- Deep understanding
- Meaningful
- Non obvious
- Actionable
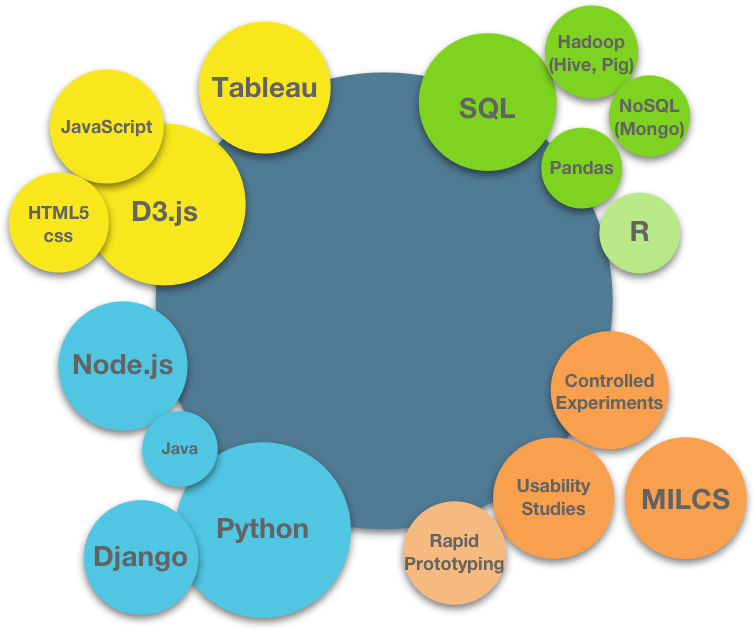
How do I do it?
What do I use?
The problem
Better techniques for browsing, navigating and summarizing large repositories of photos
History
Photofinder
PhotoMesa
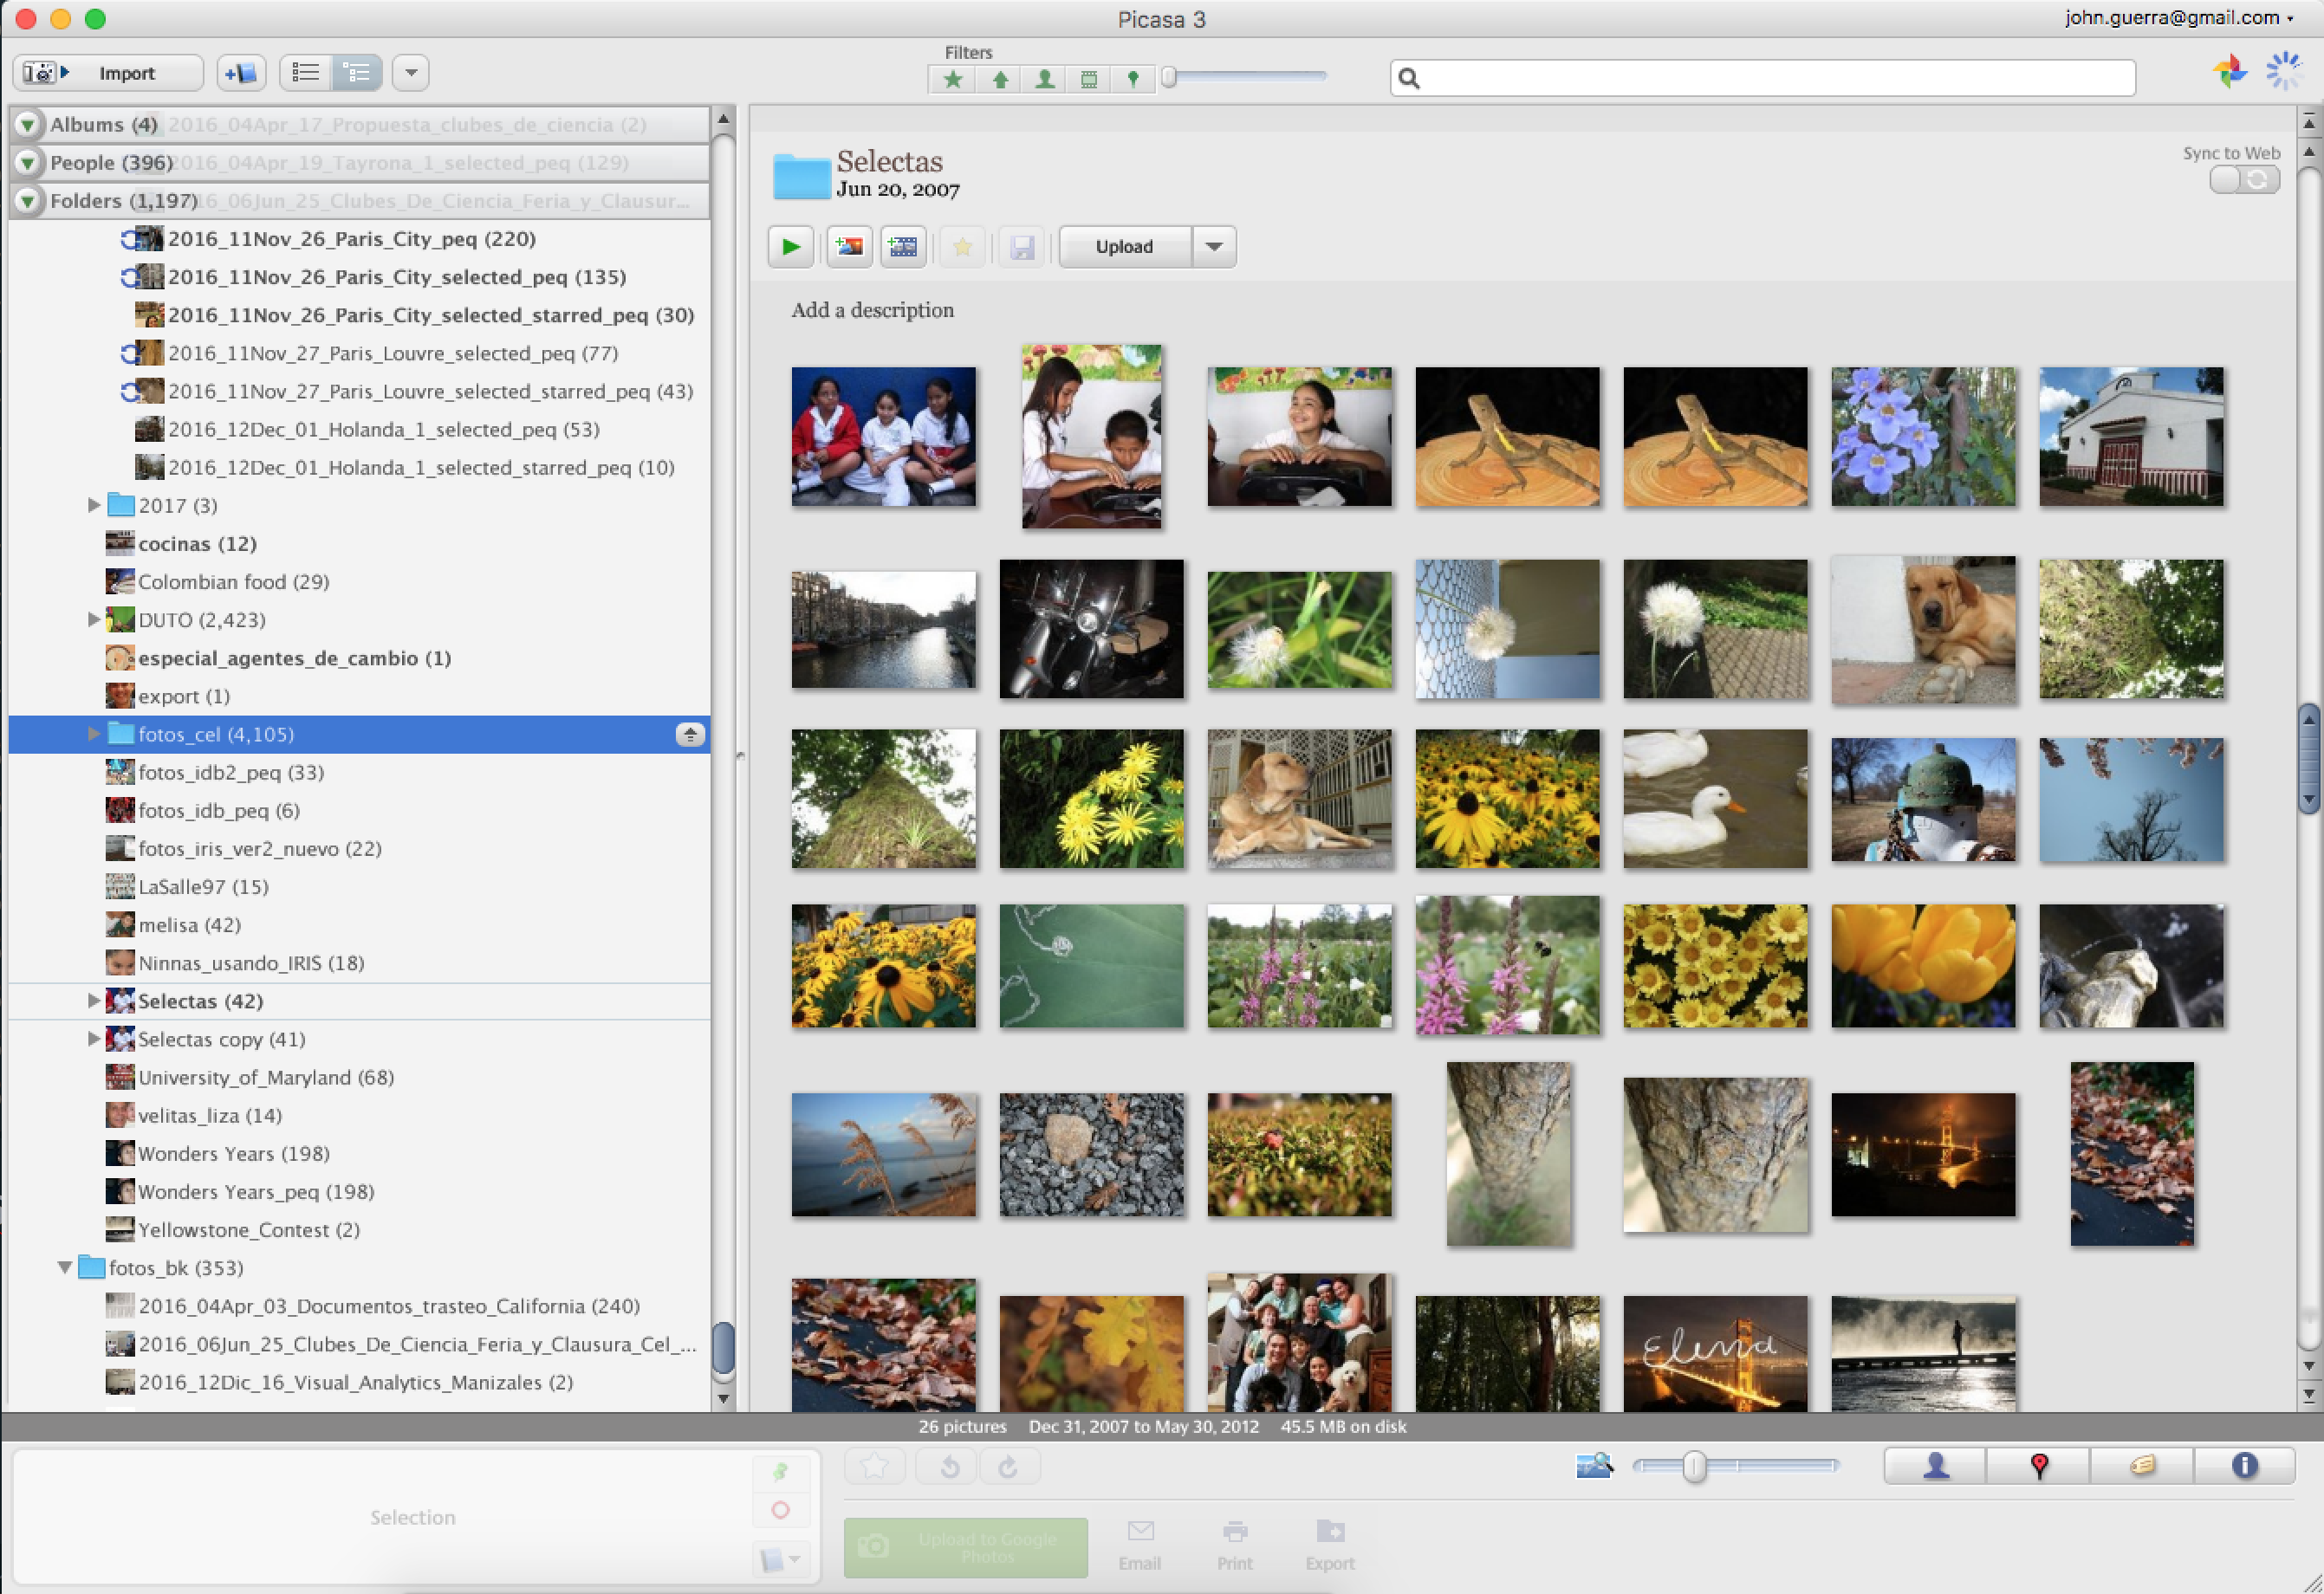
Picasa
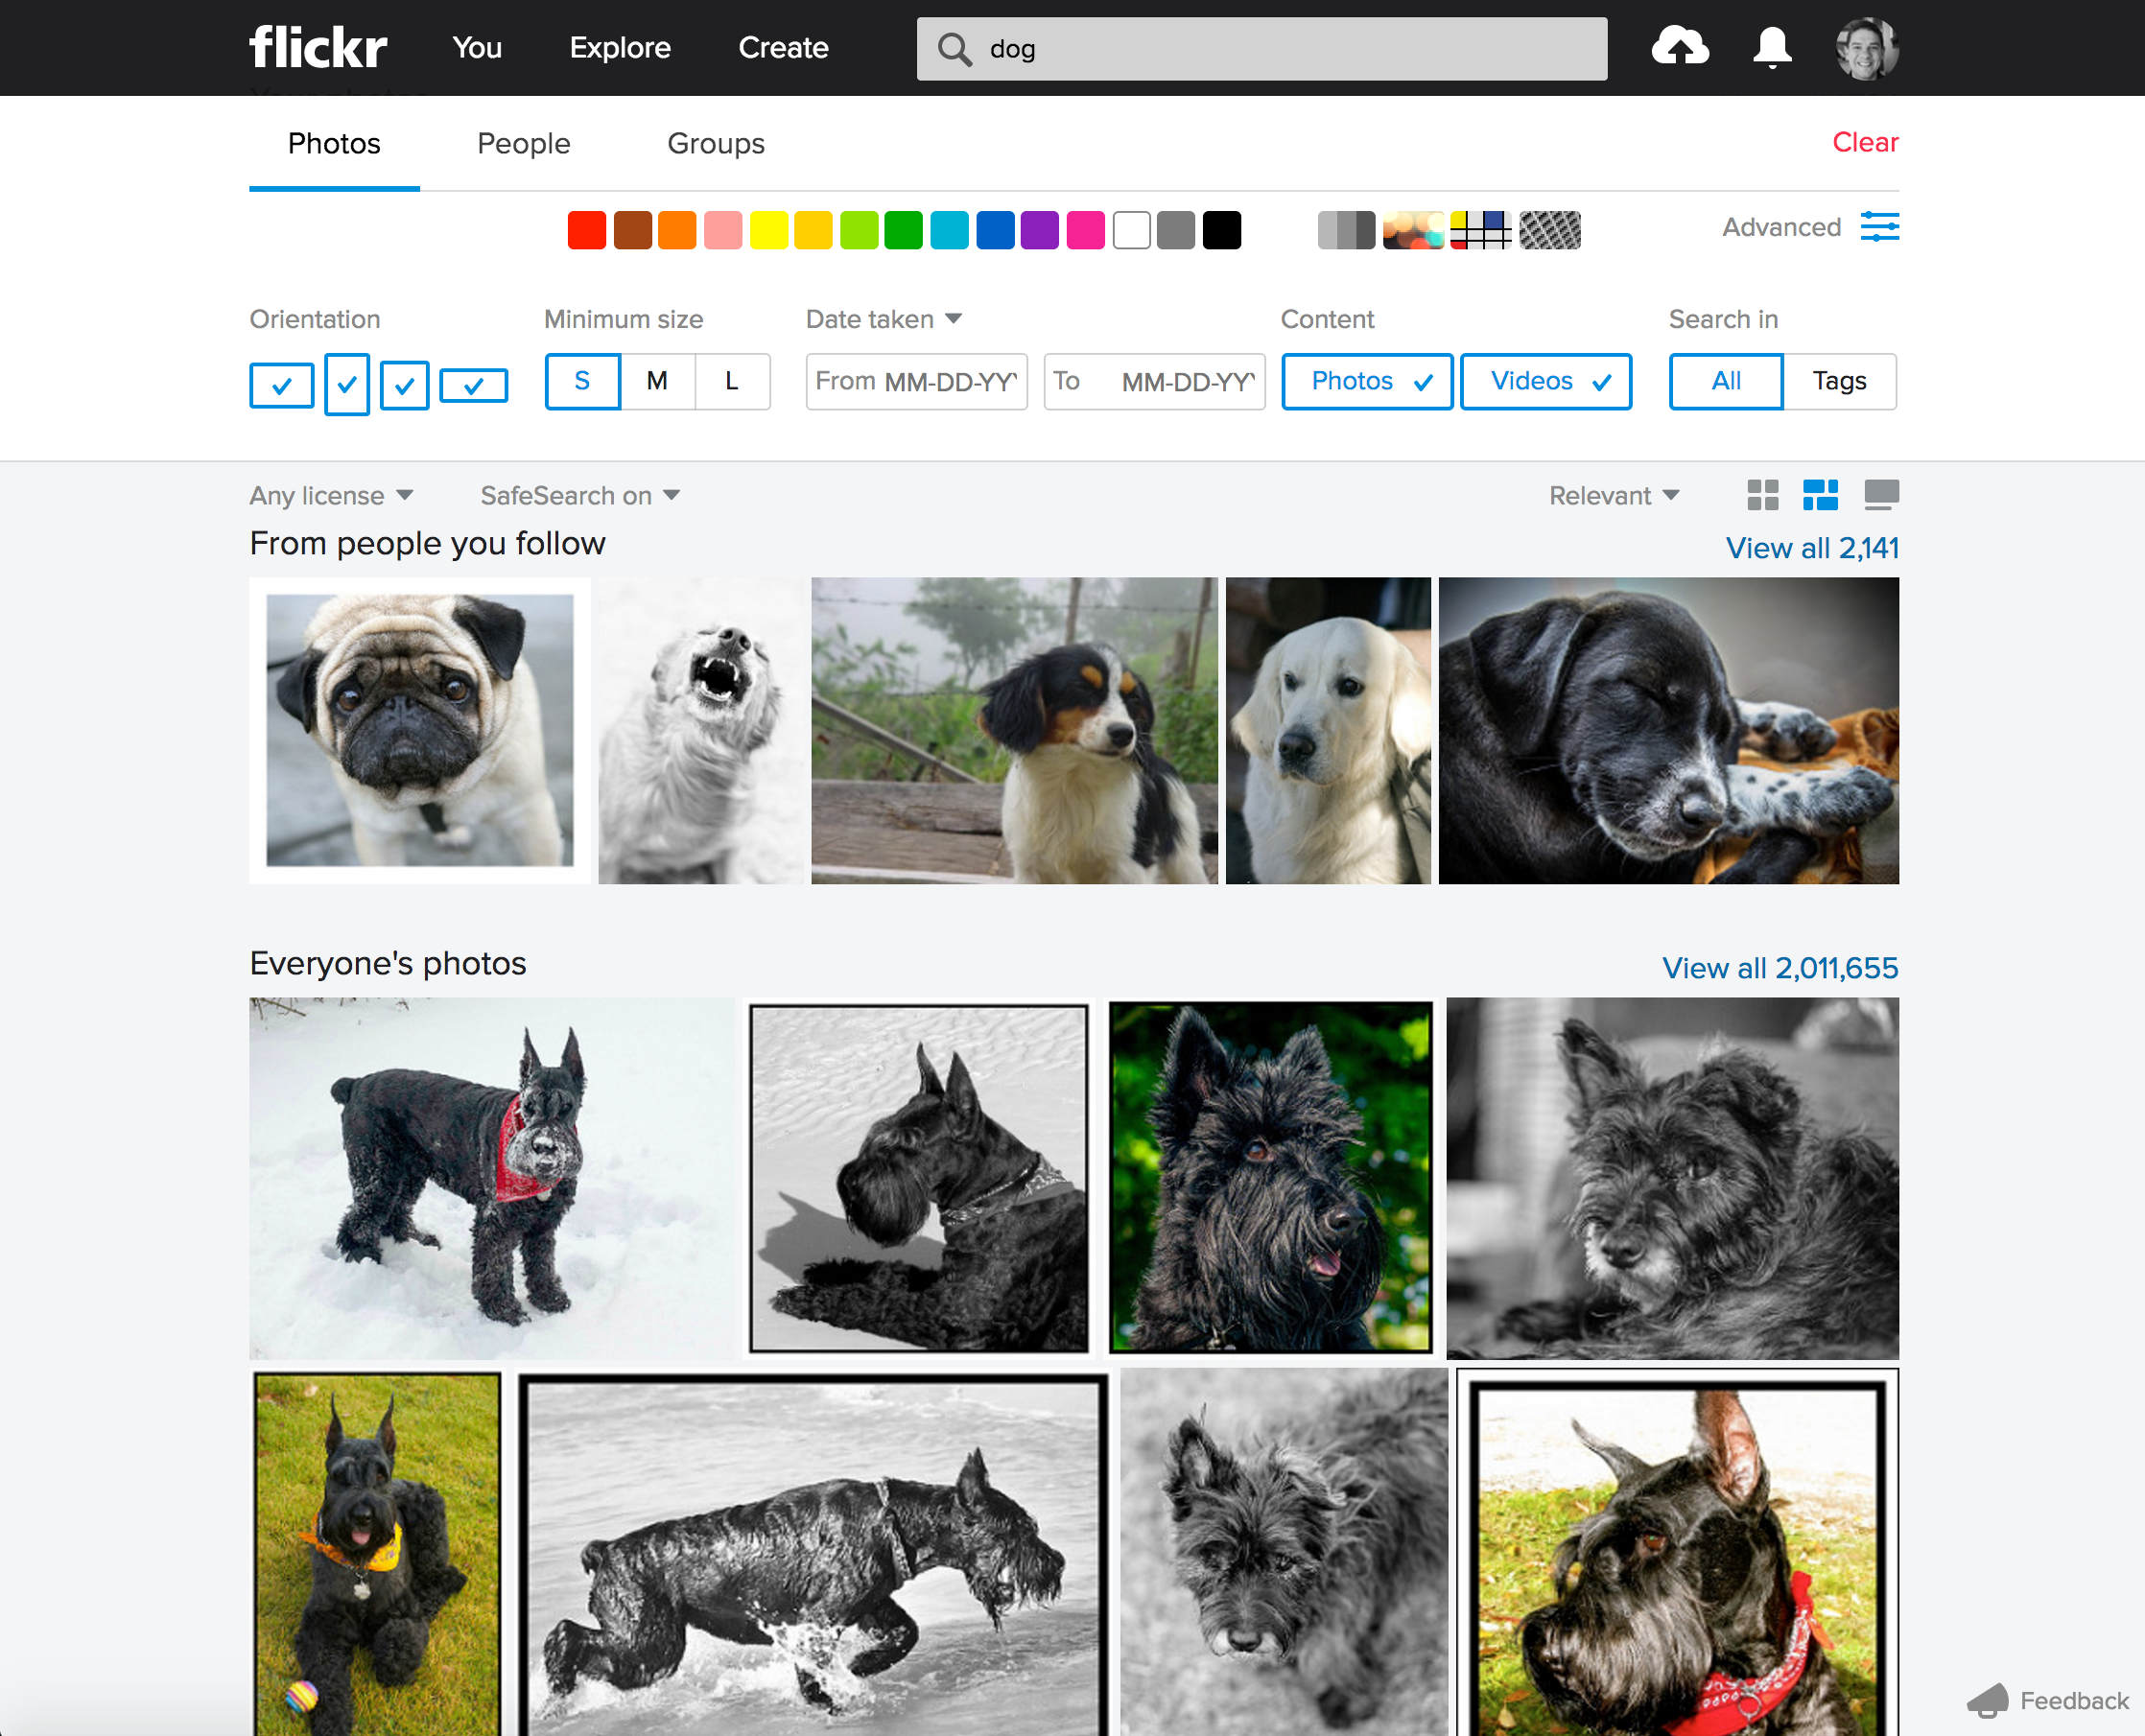
Today
- Flickr
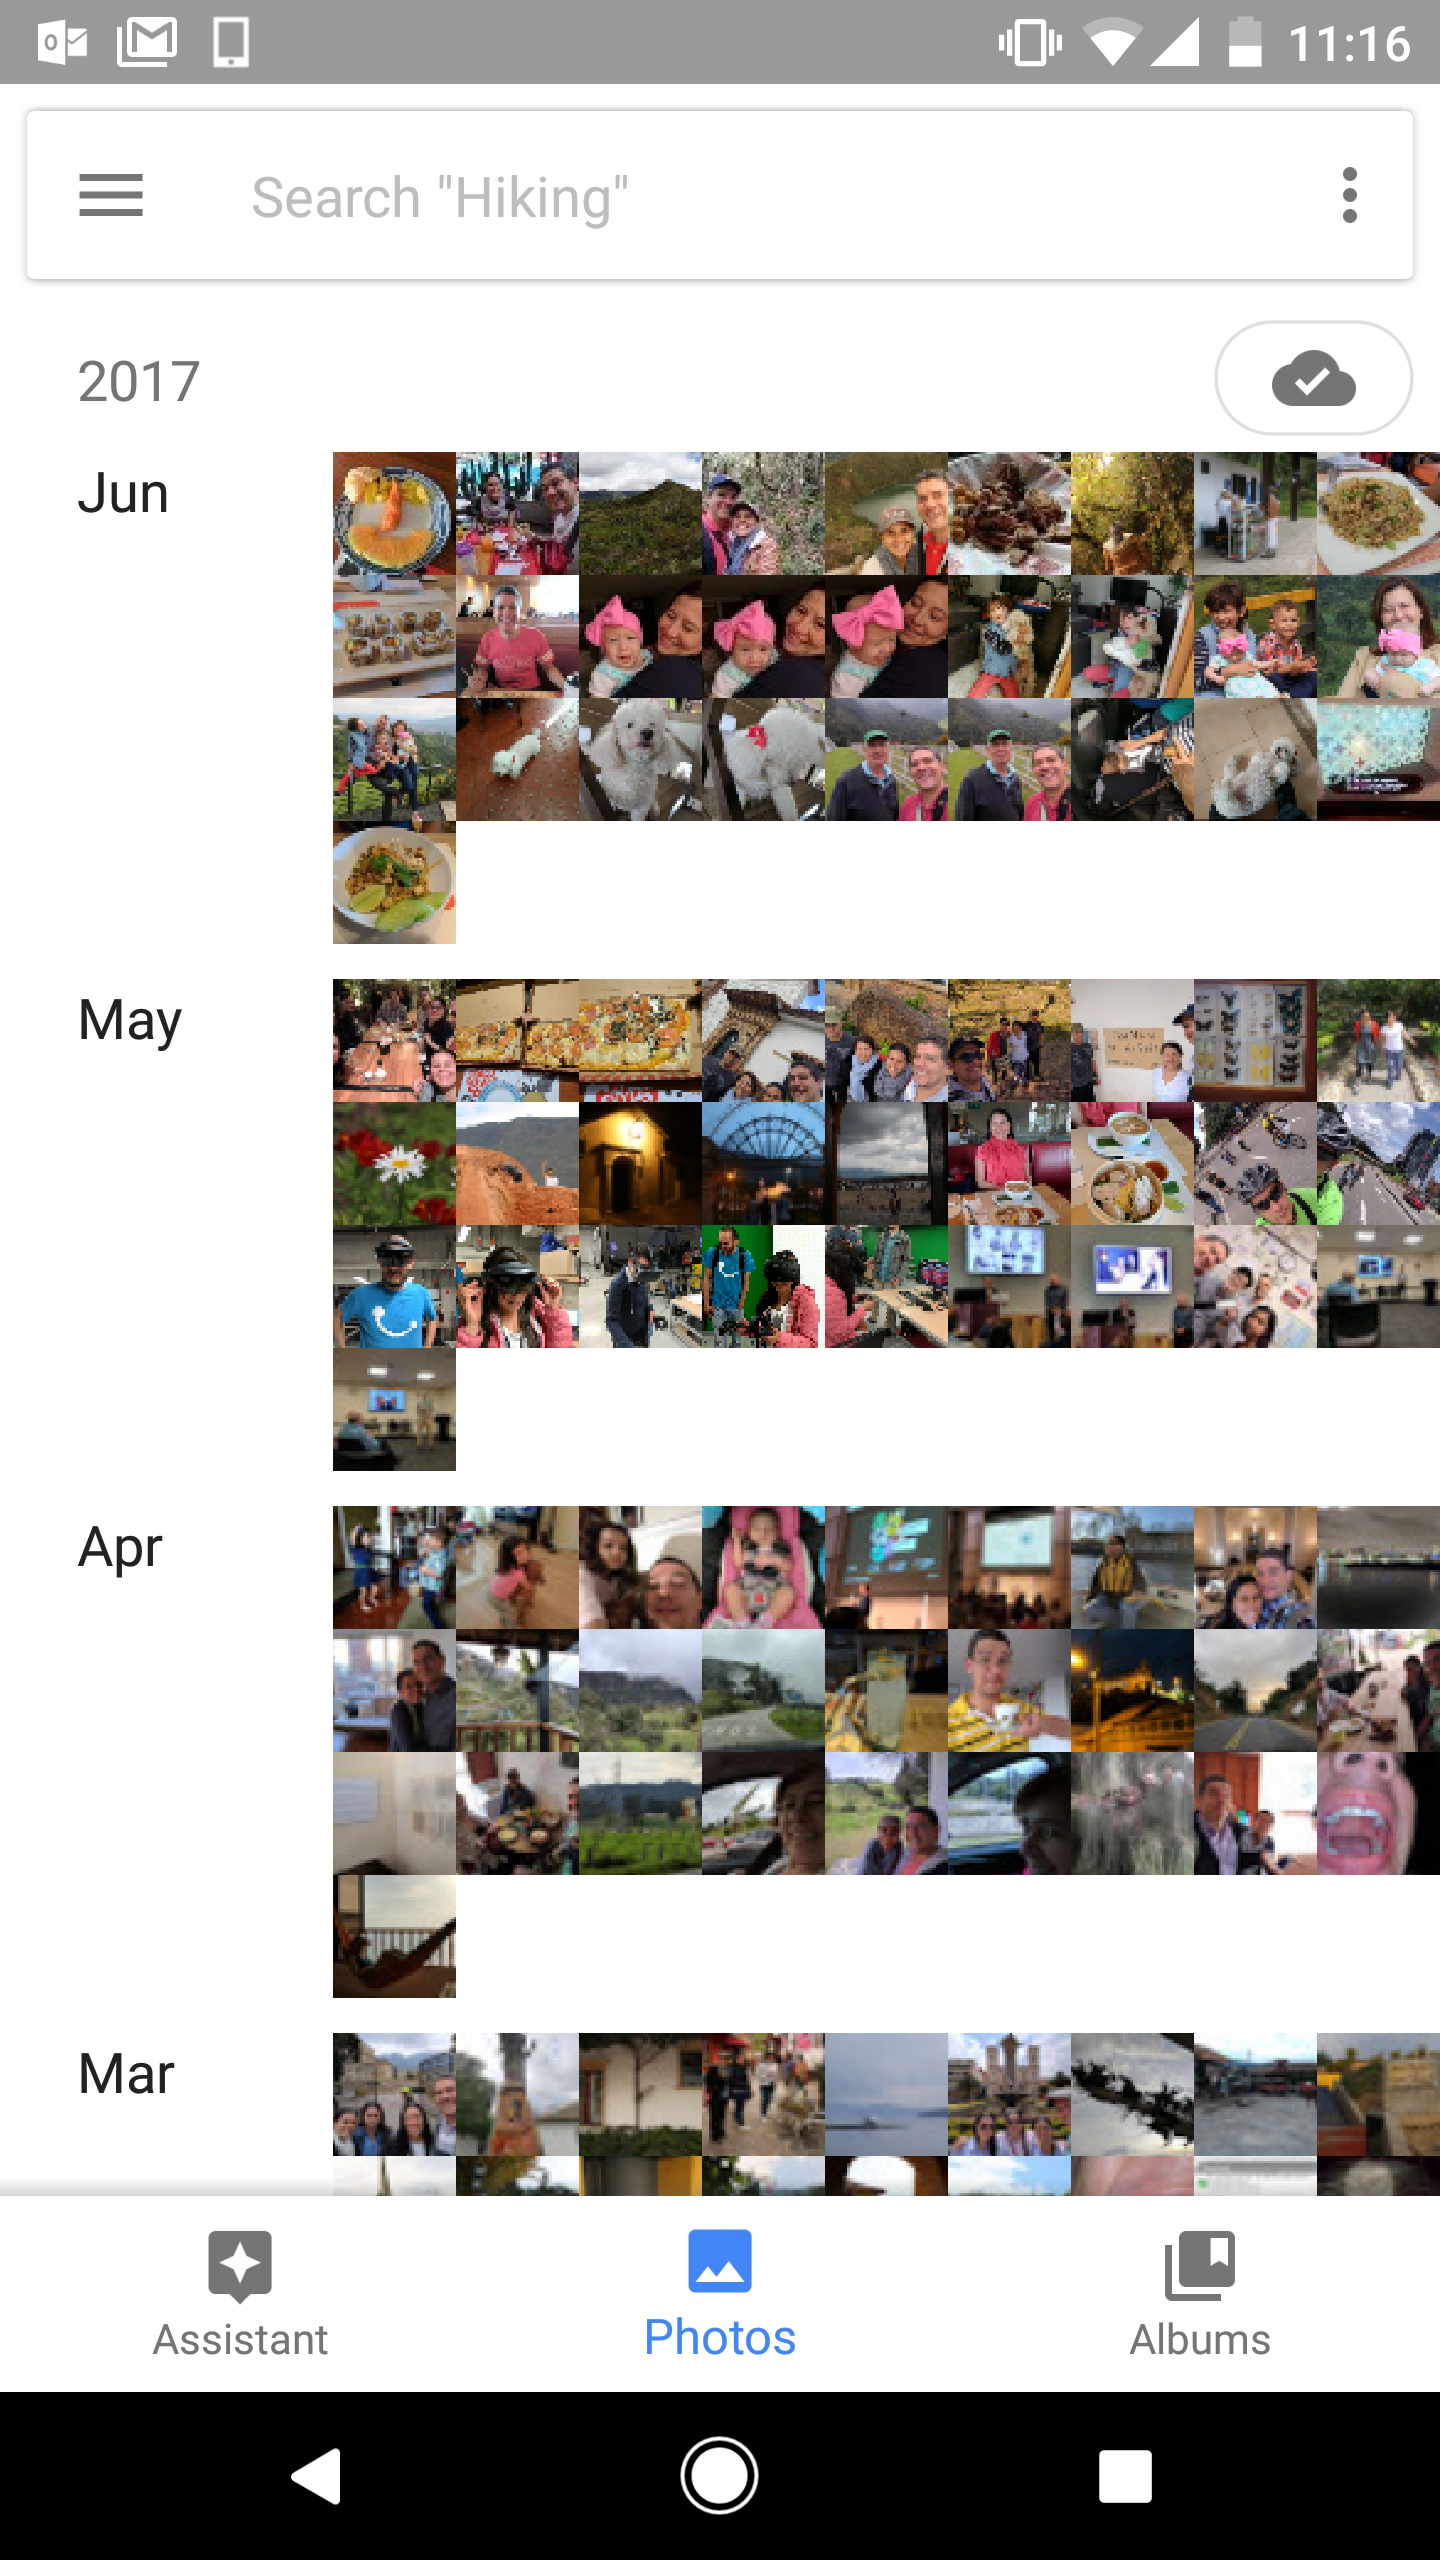
- Google Photos
- Apple Photos
Summarizing
How to show many photos at once
Google Photos
Moma's collection
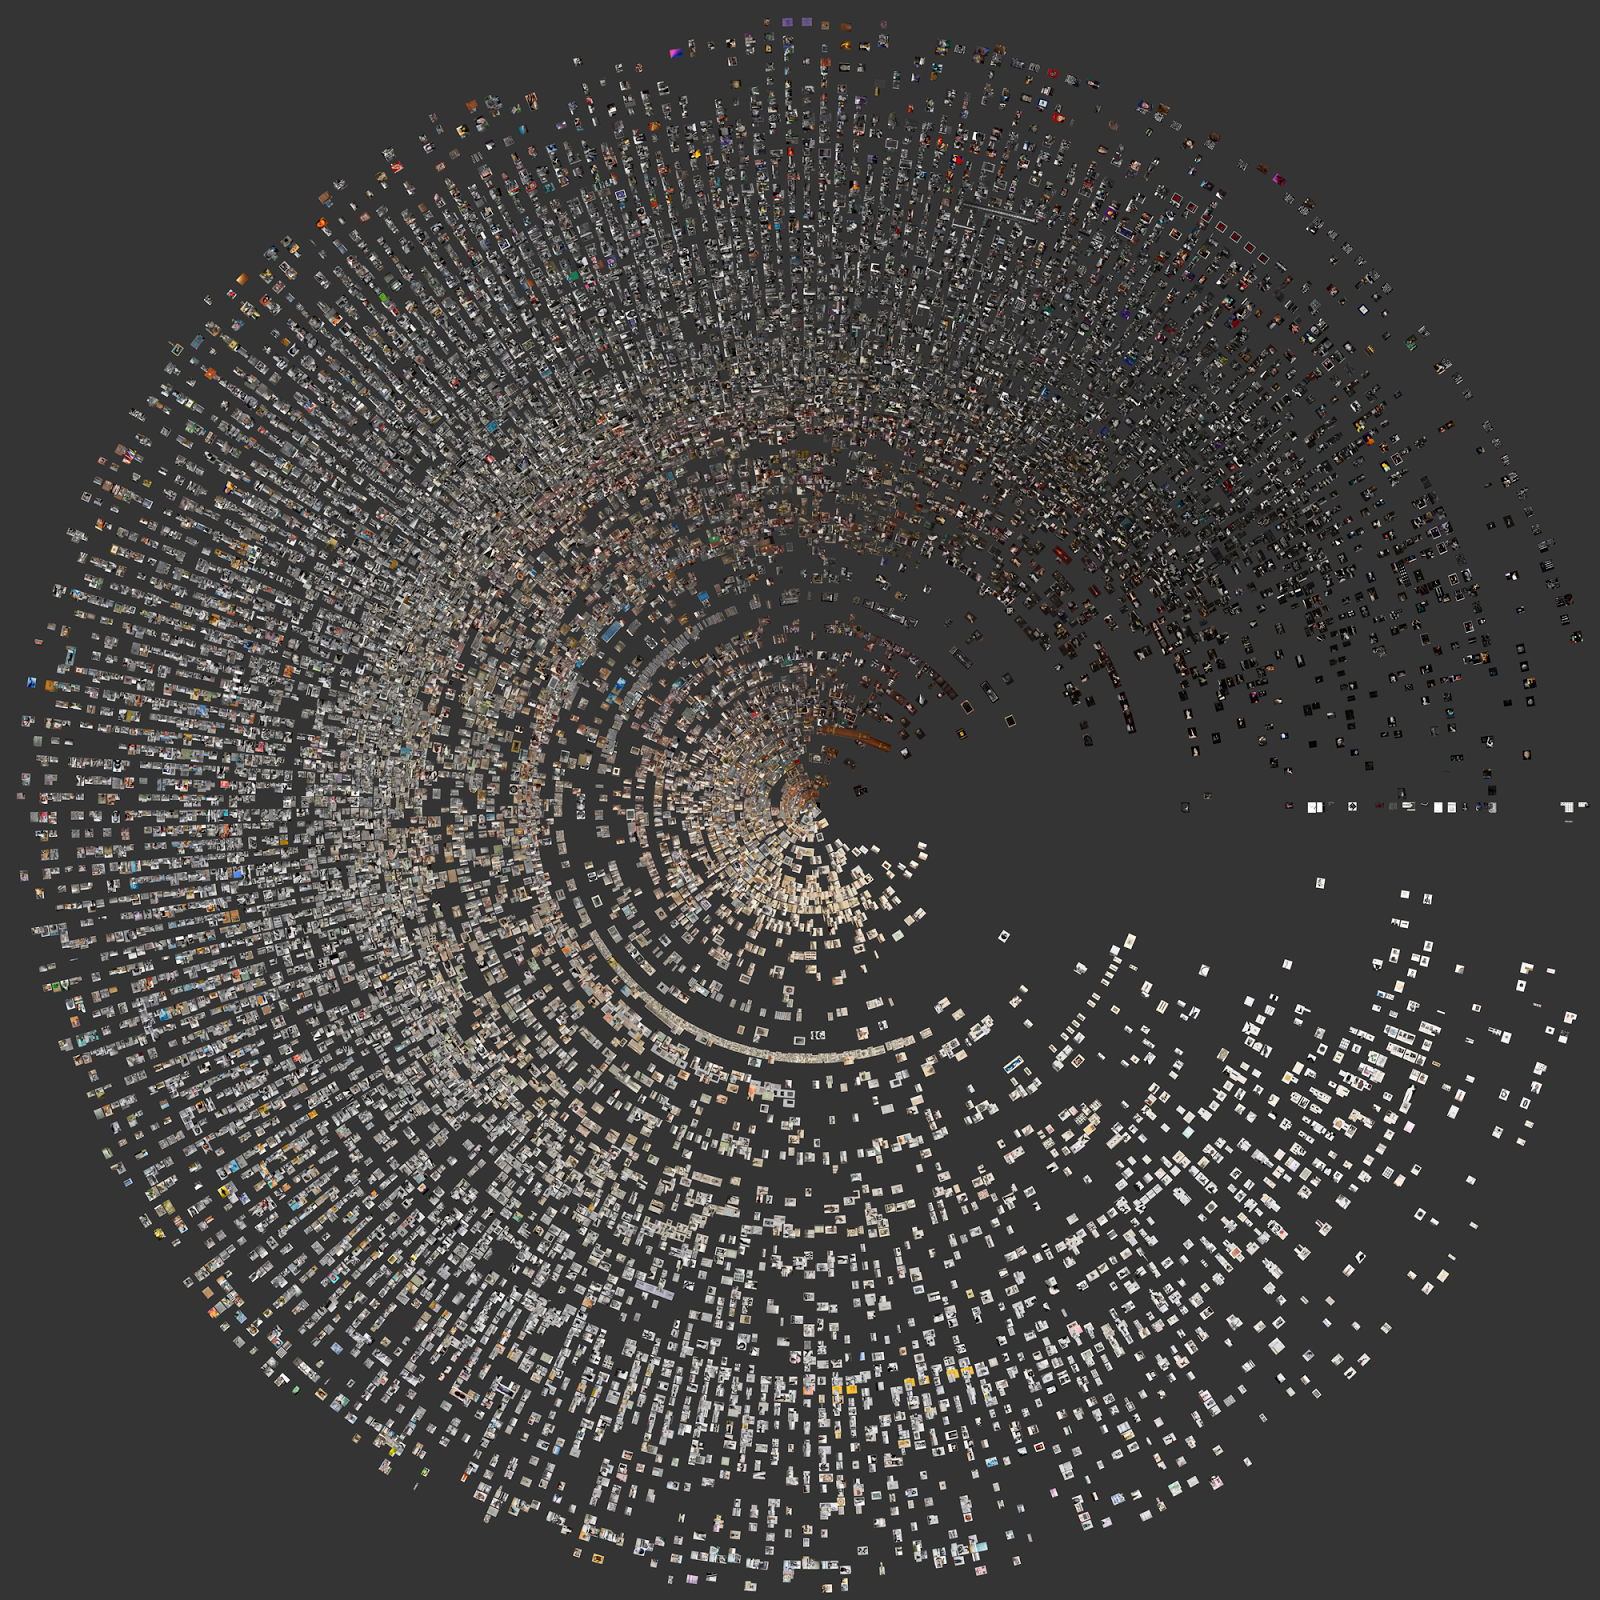
Photo Treemap
Work with Cati Boulanger, Sanjay Kairam, Frank Bentley, Joseph ‘Jofish’ Kaye, David A. Shamma


How to display groups of photos?
What if the photos have also statistics?
What are the best practices for representing photos with associated statistics with treemaps?
Experiment 1:
Photo count
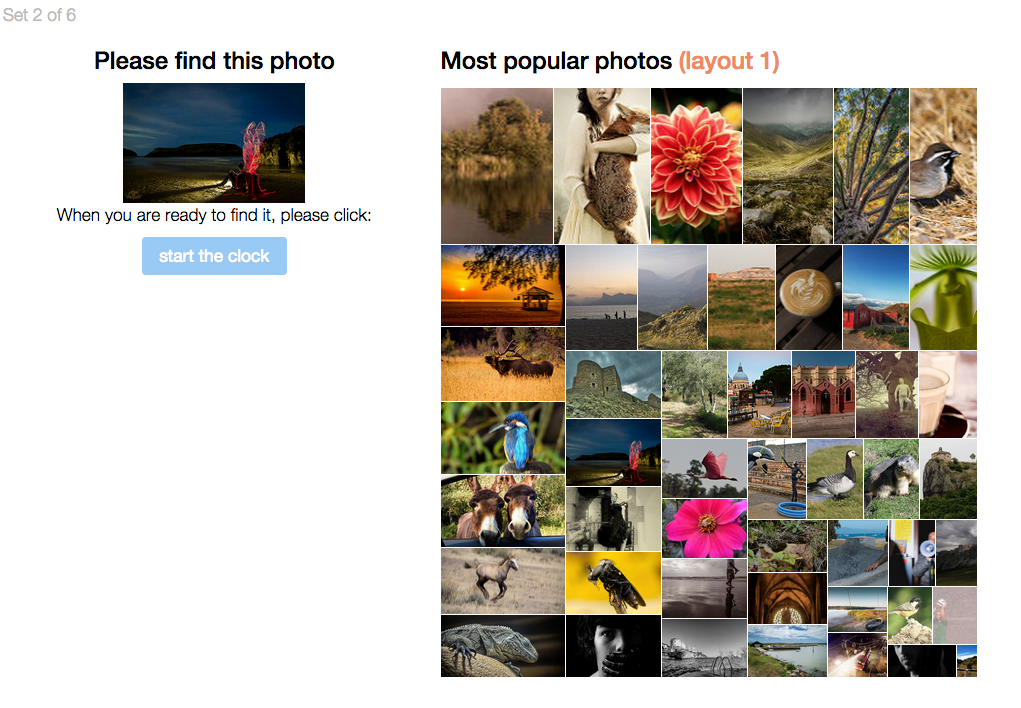
Ex1. Demo
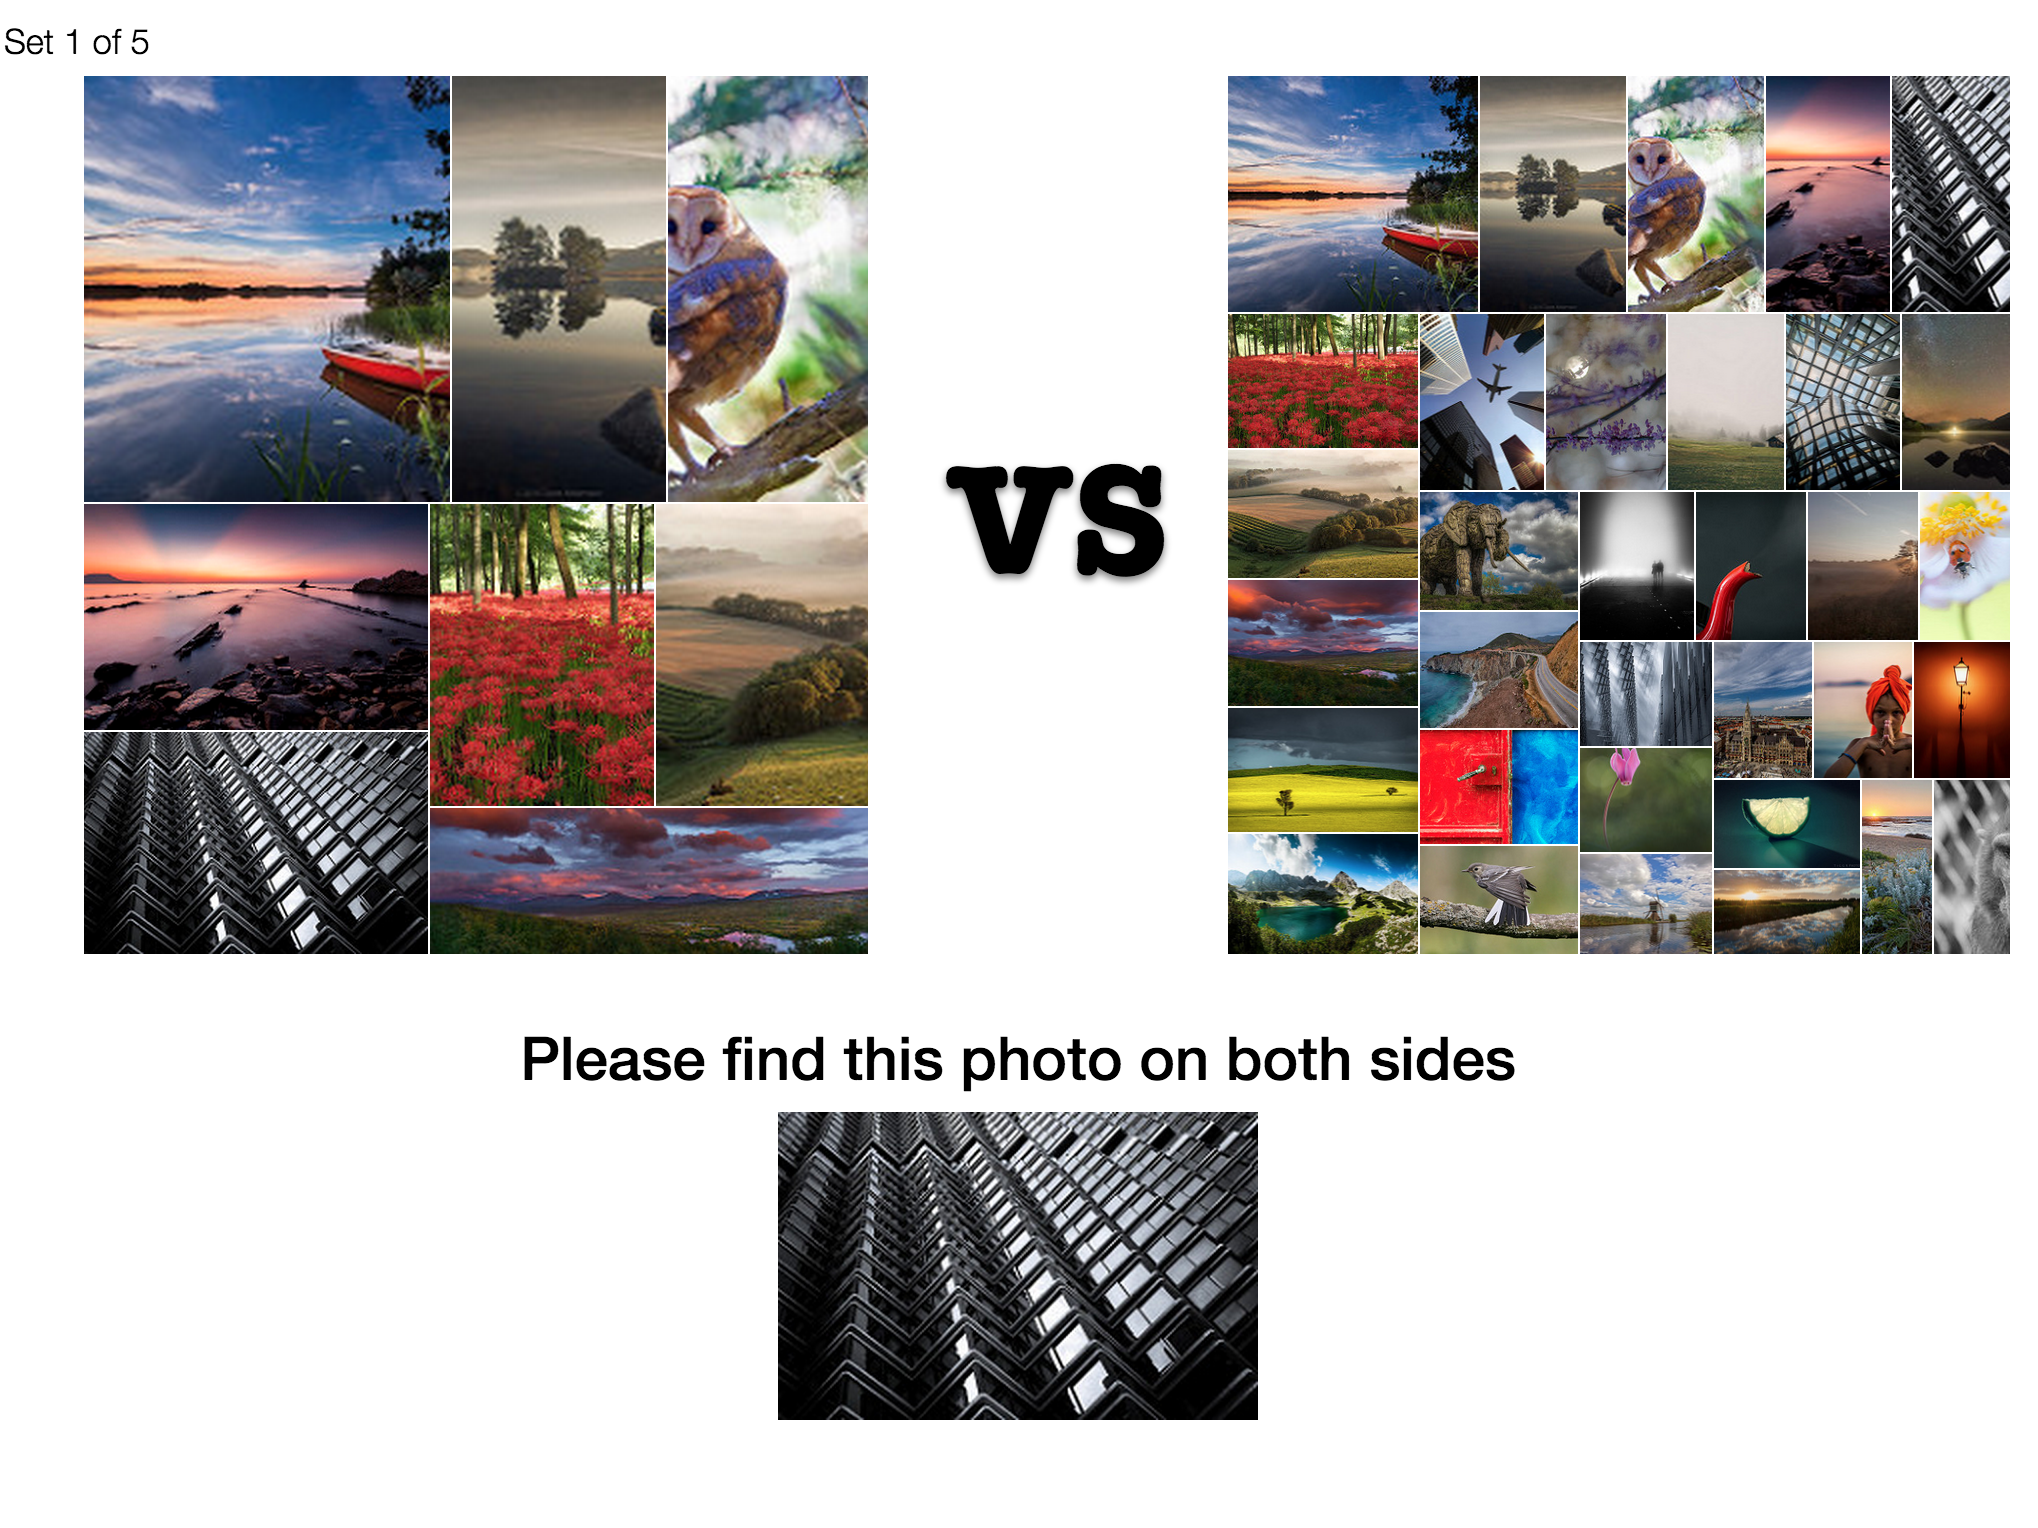
We measured
- Time to find photo
- User preference
Ex1. Demographics
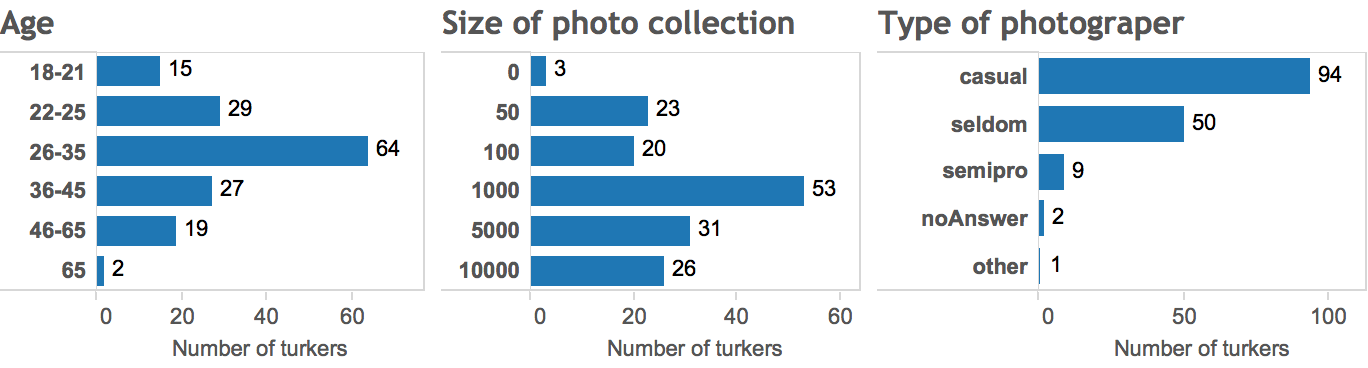
154 Mechanical Turk Responses (67 women)
Ex1. Results
Avg time to find depending on photo position
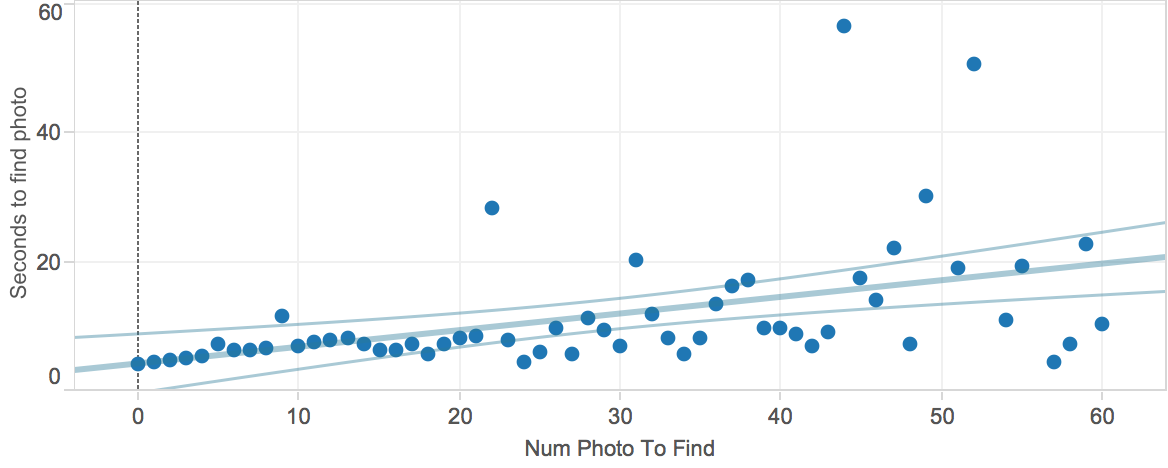
Photo count sweet spot
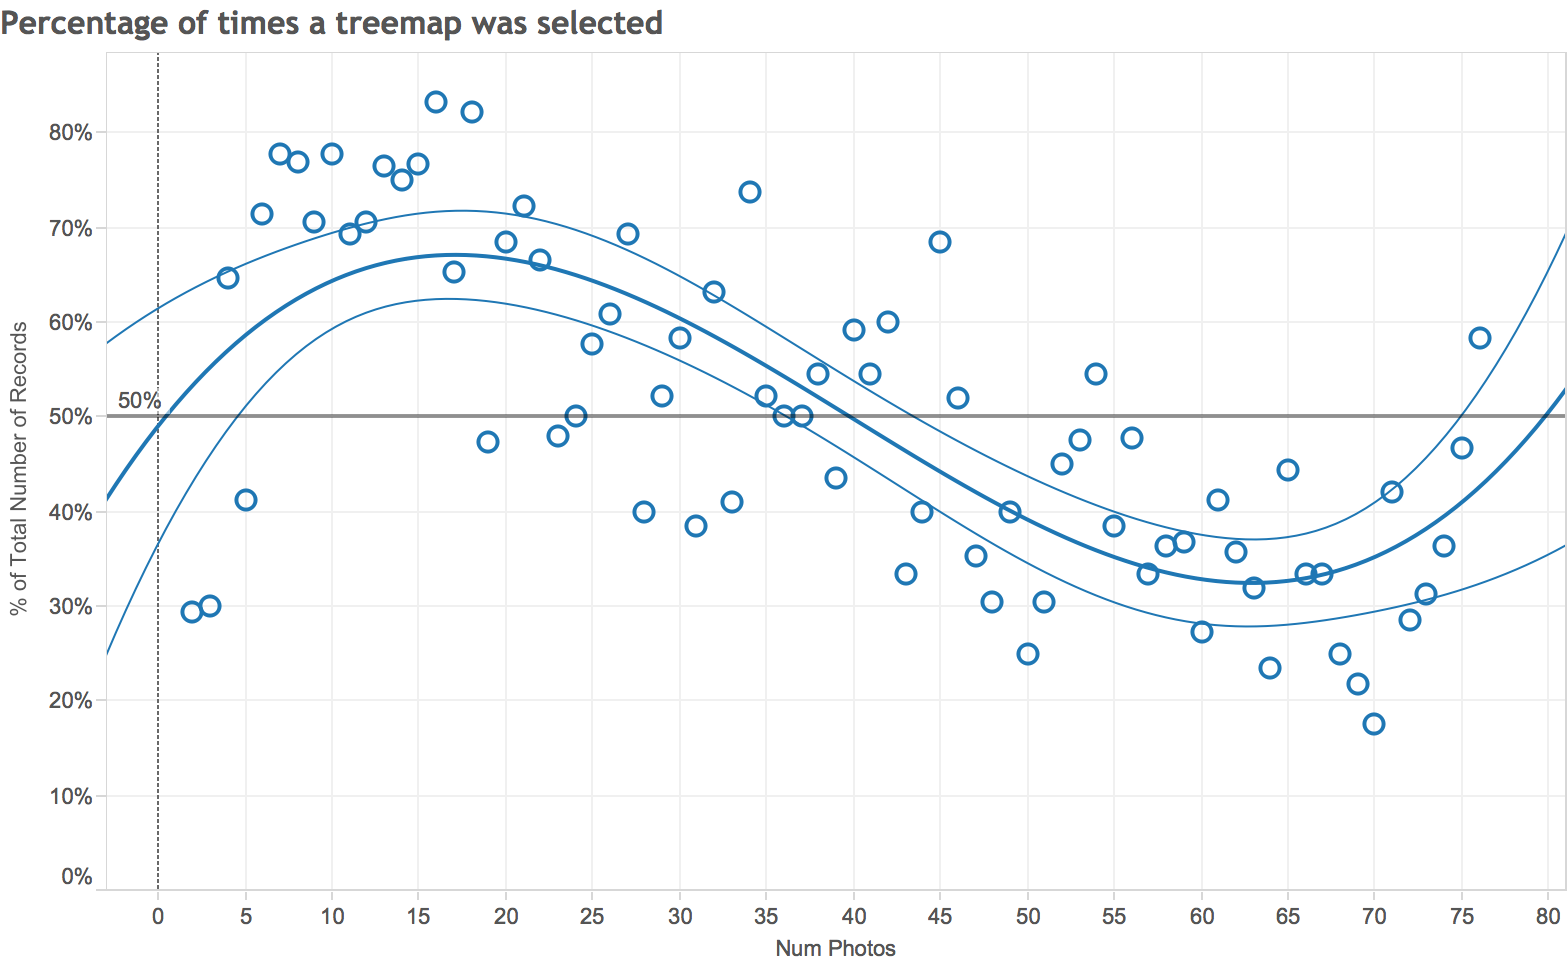
For a 390x440px phototreemap
Experiment 2:
Layout
Demo
We measured
- Time to find photos
- Number of errors
- Accuracy
- User preference
Ex2. Demographics
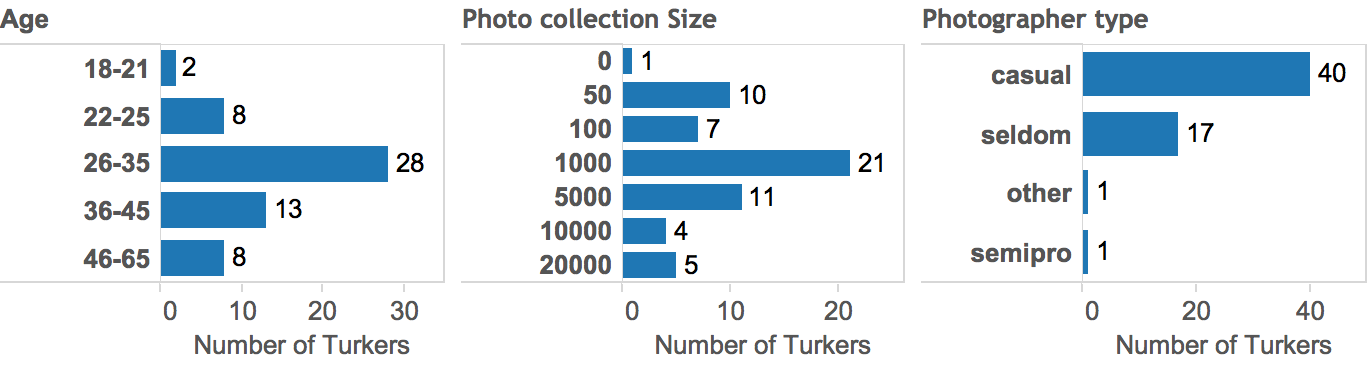
63 responses (27 women)
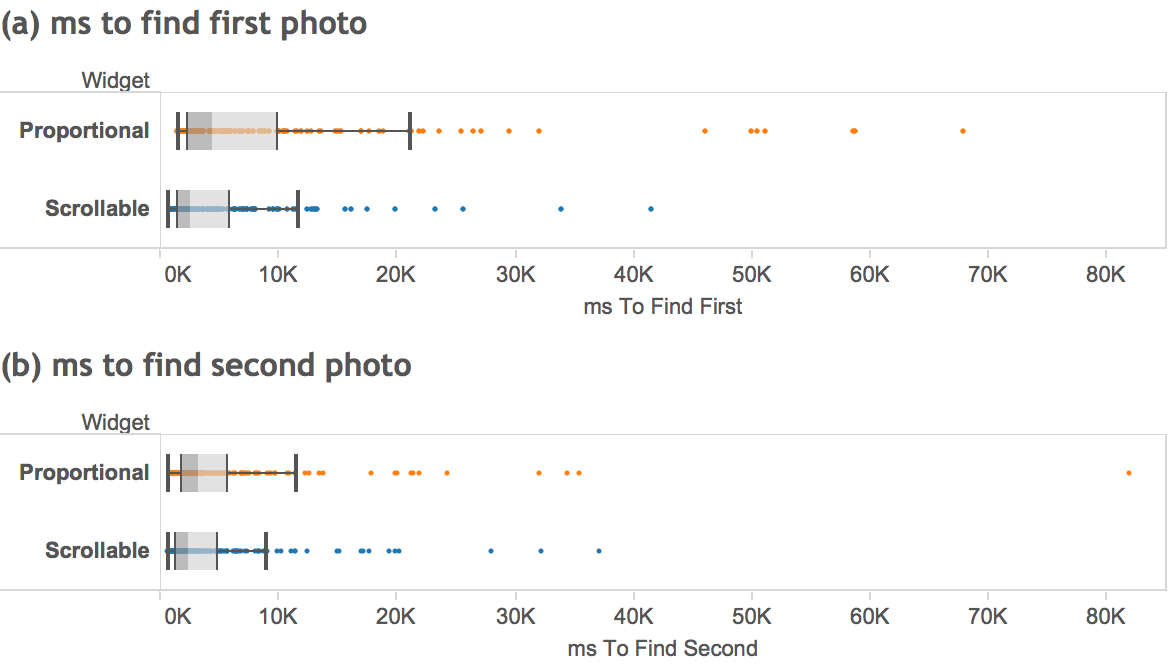
Time to find photo (ms)
Errors
| Proportional | 47 |
| Scrollable | 21 |
Accuracy
| Proportional | 86.44% |
| Scrollable | 77.97% |
User preference
81.3% of the participants preferred the scrollable layout
Experiment 3:
User Study
Design
- 7 participants
- Users viewed their own photos
- 5 point likert scale on usefulness and pleasingness for 3x2 configurations
- Labels vs no Labels
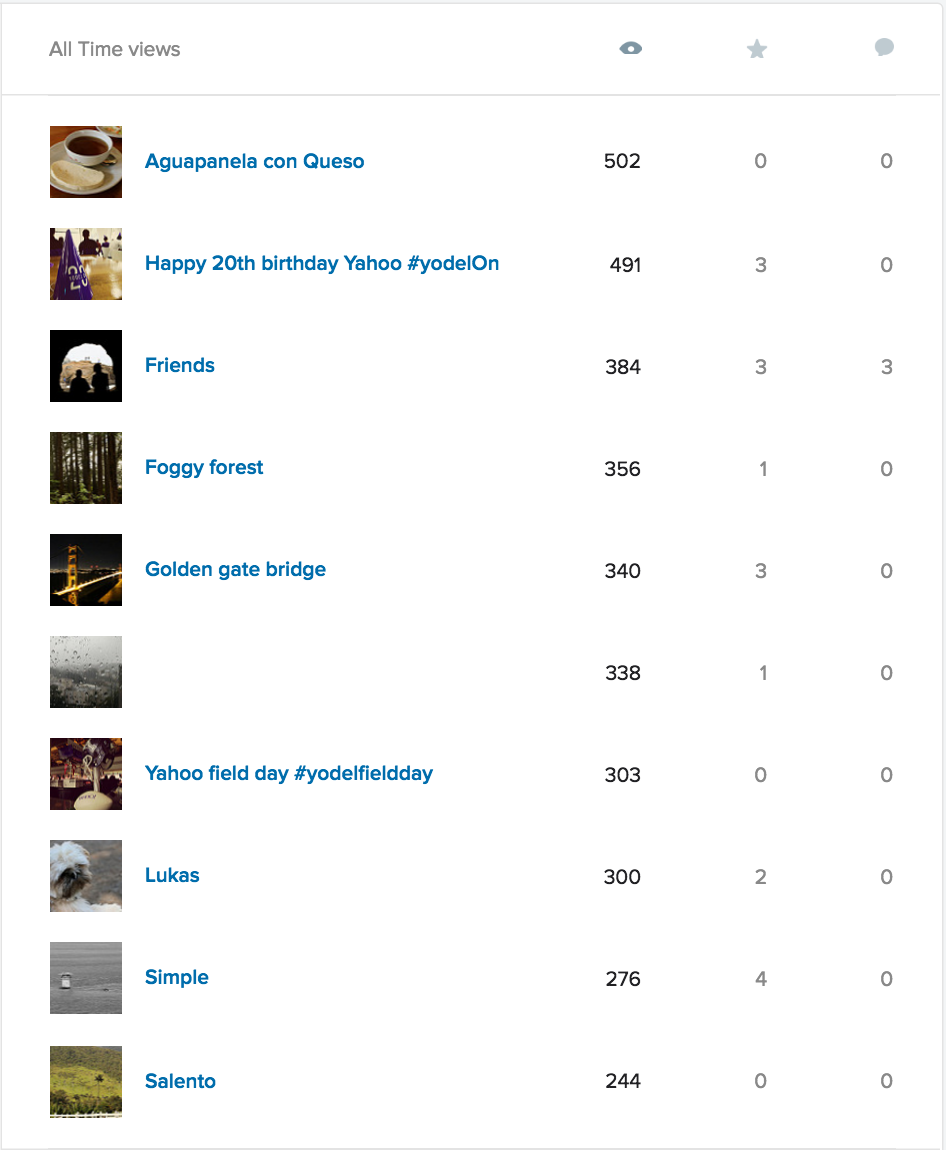
- Size and sorting by views, comments or favorites
Configuration preference
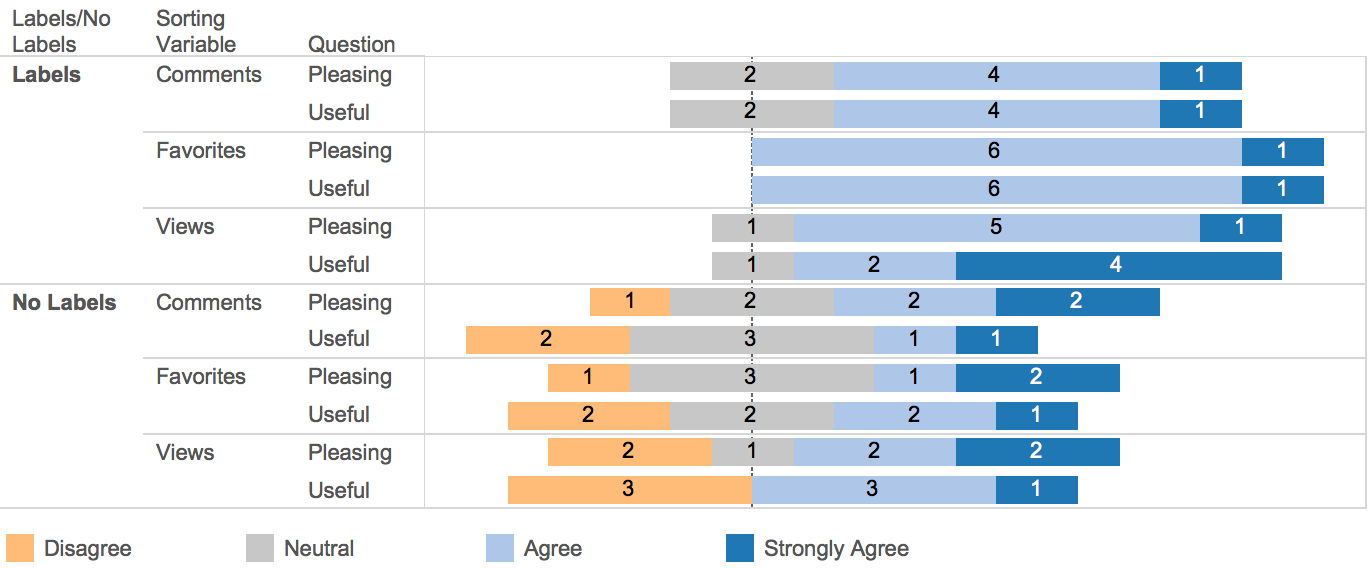
Conclusions
- Small number of photos is better but not too small
- Cropping and aspect ration has a big impact
- Scrolling can be preferable to cropping
- Labels are important
Navigation
Allow the user to explore a large photo repository without a defined query
Flickr
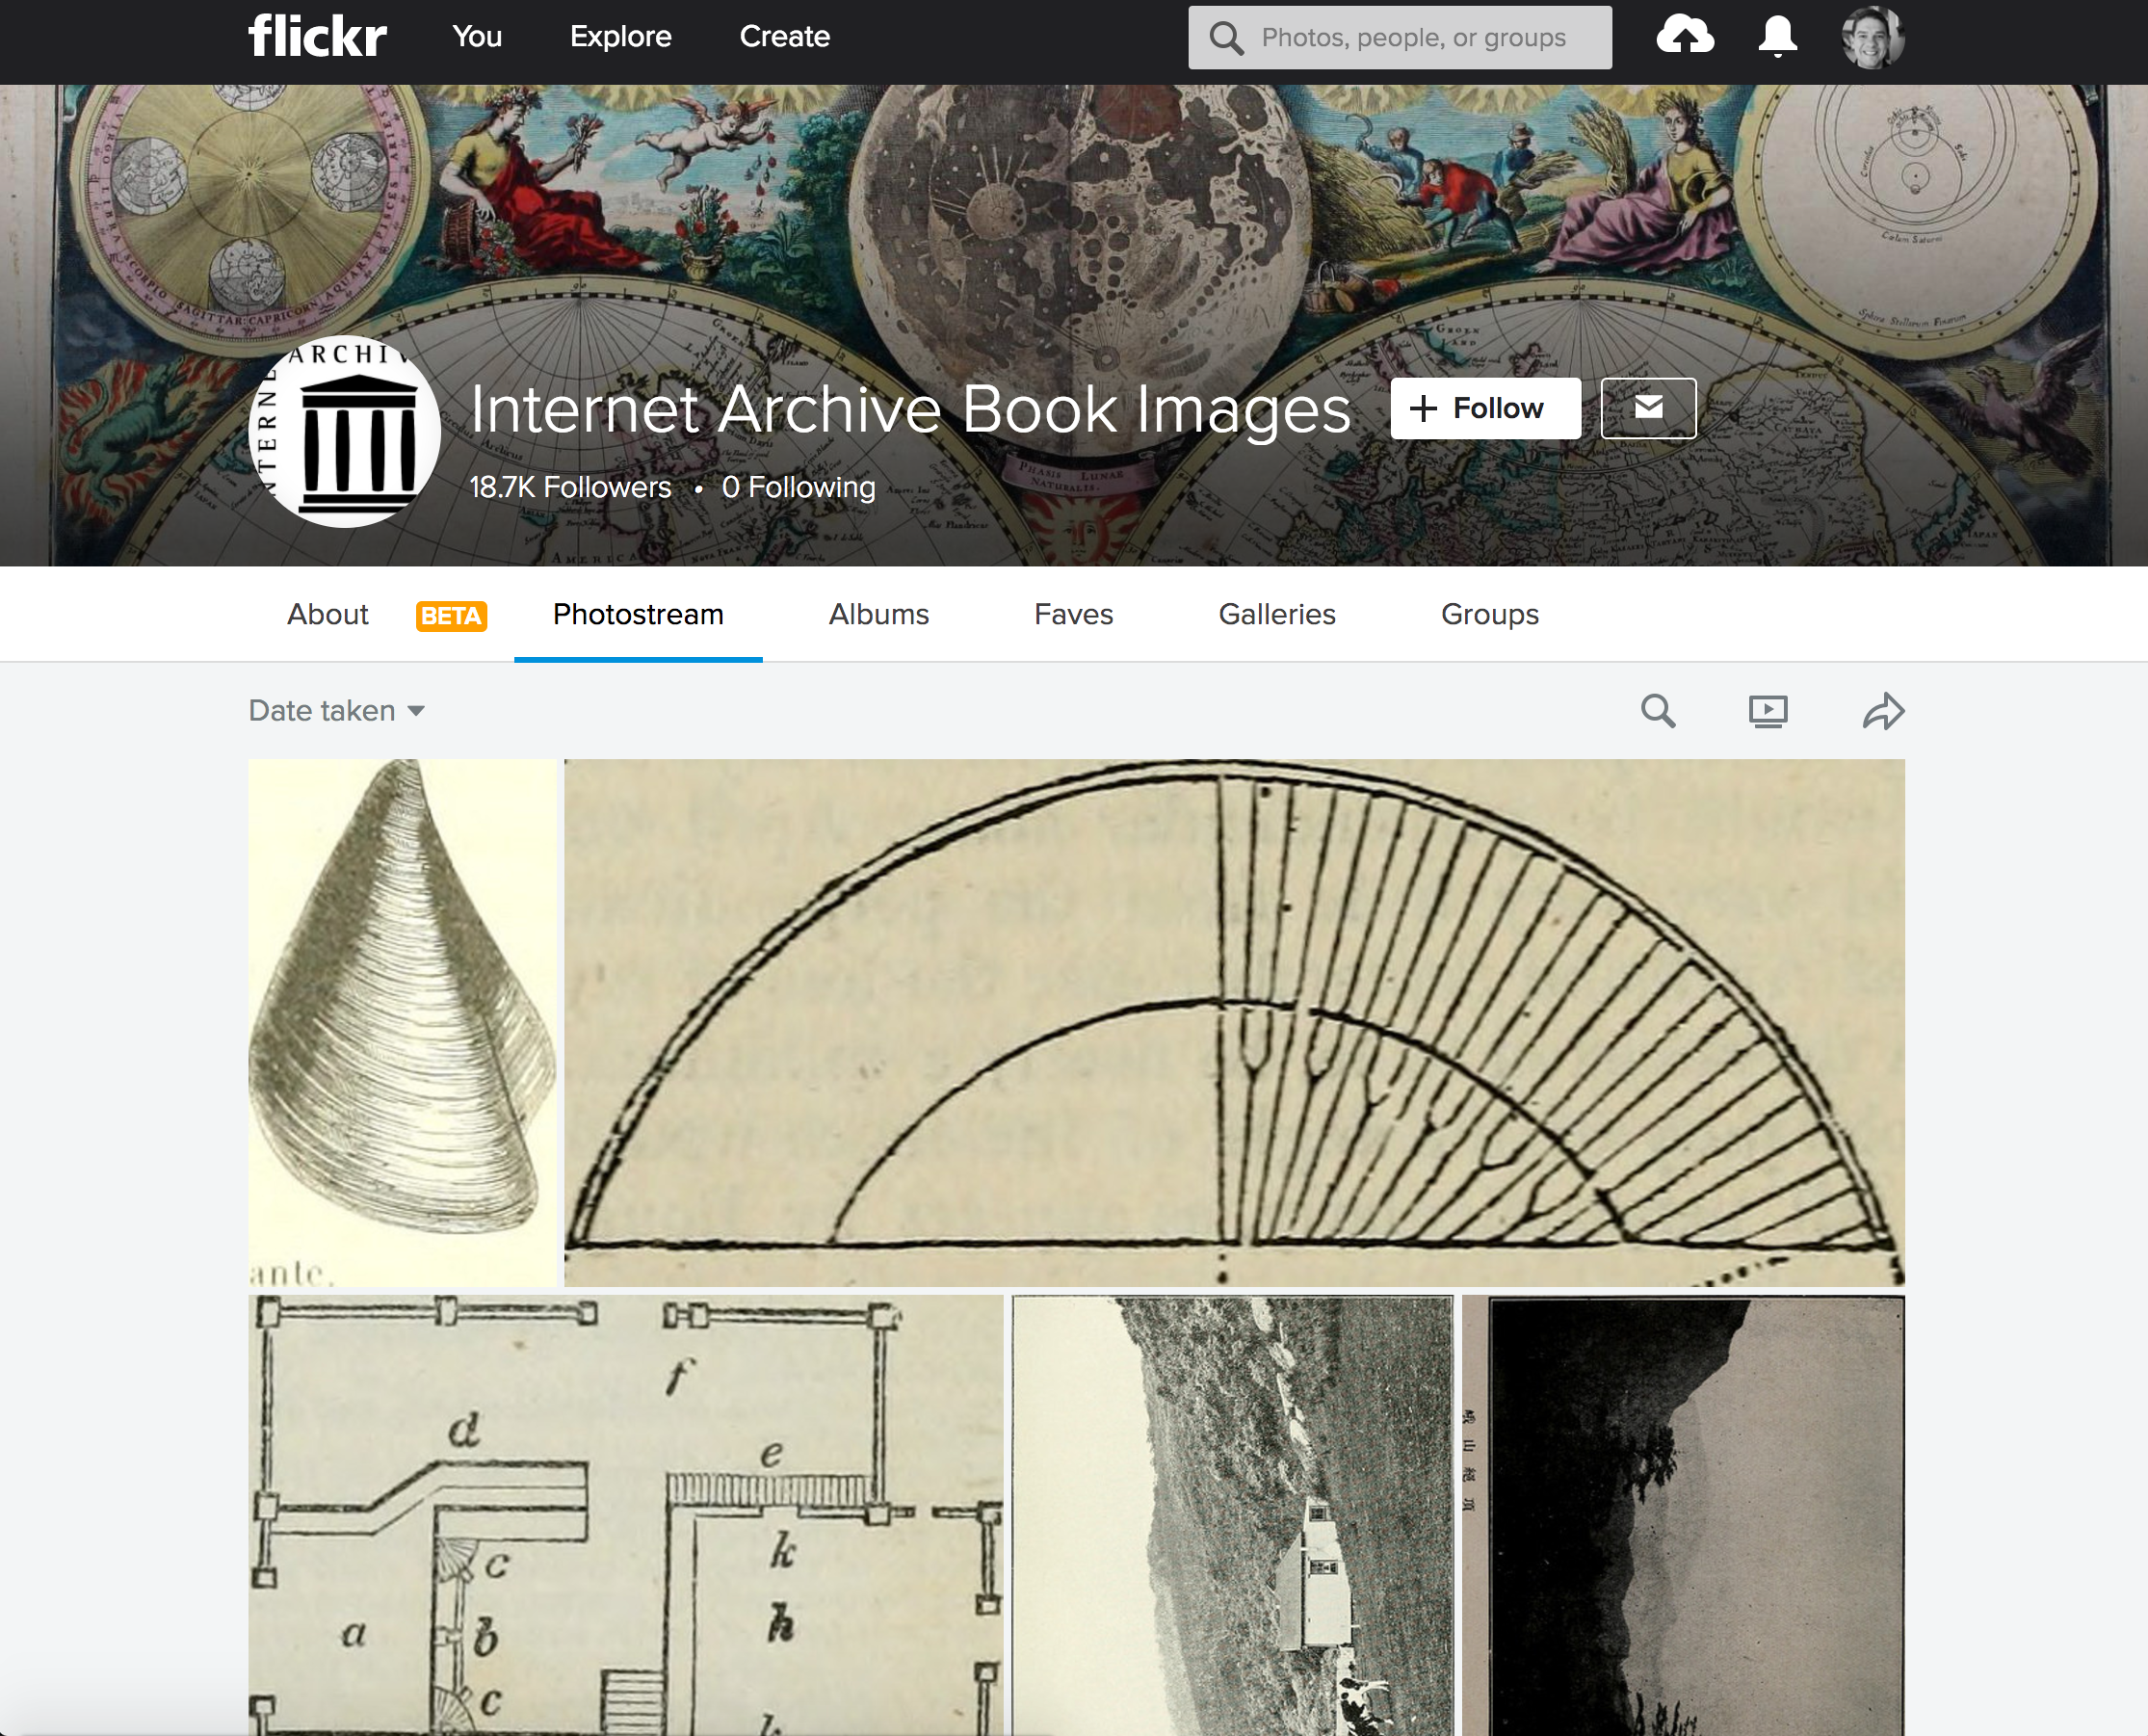
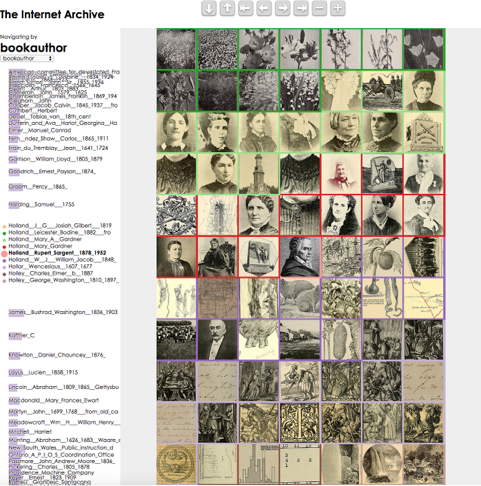
Zoomable Photo Treemap
Photo widget to show many photos at once with numeric values and categorical groupings
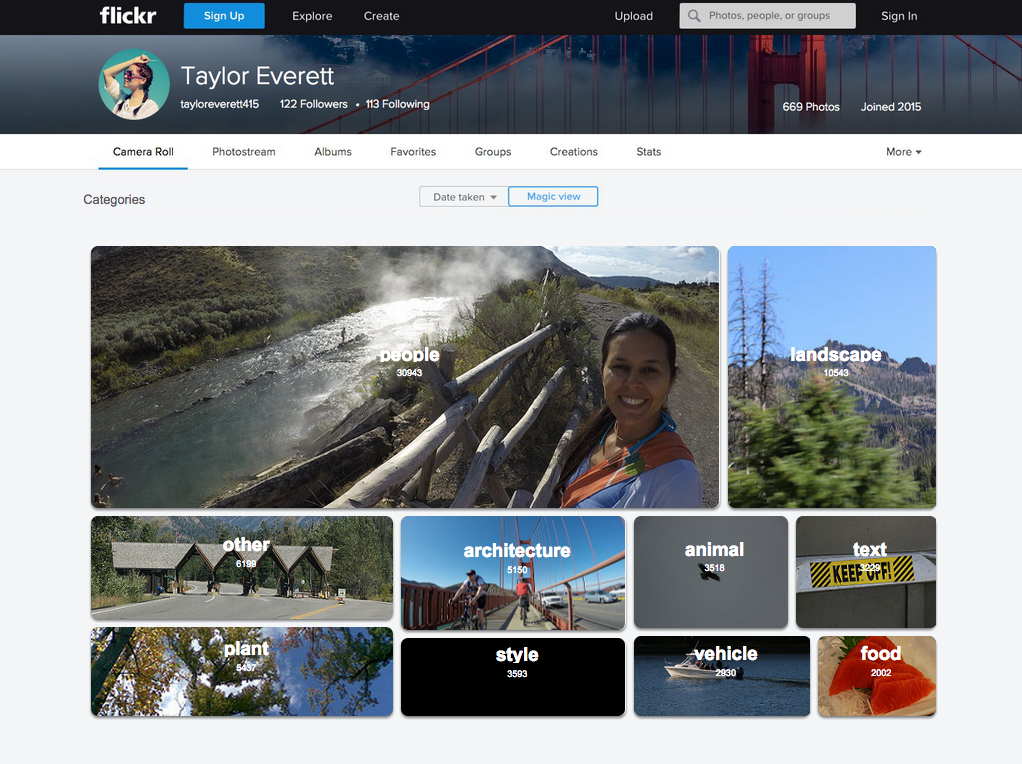
Flickr's Magic View
PhotoRing
How to better allow exploration and navigation of millions on photos
Browsing
Allow the user to find specific photos on a large photo repository
Other work with photos
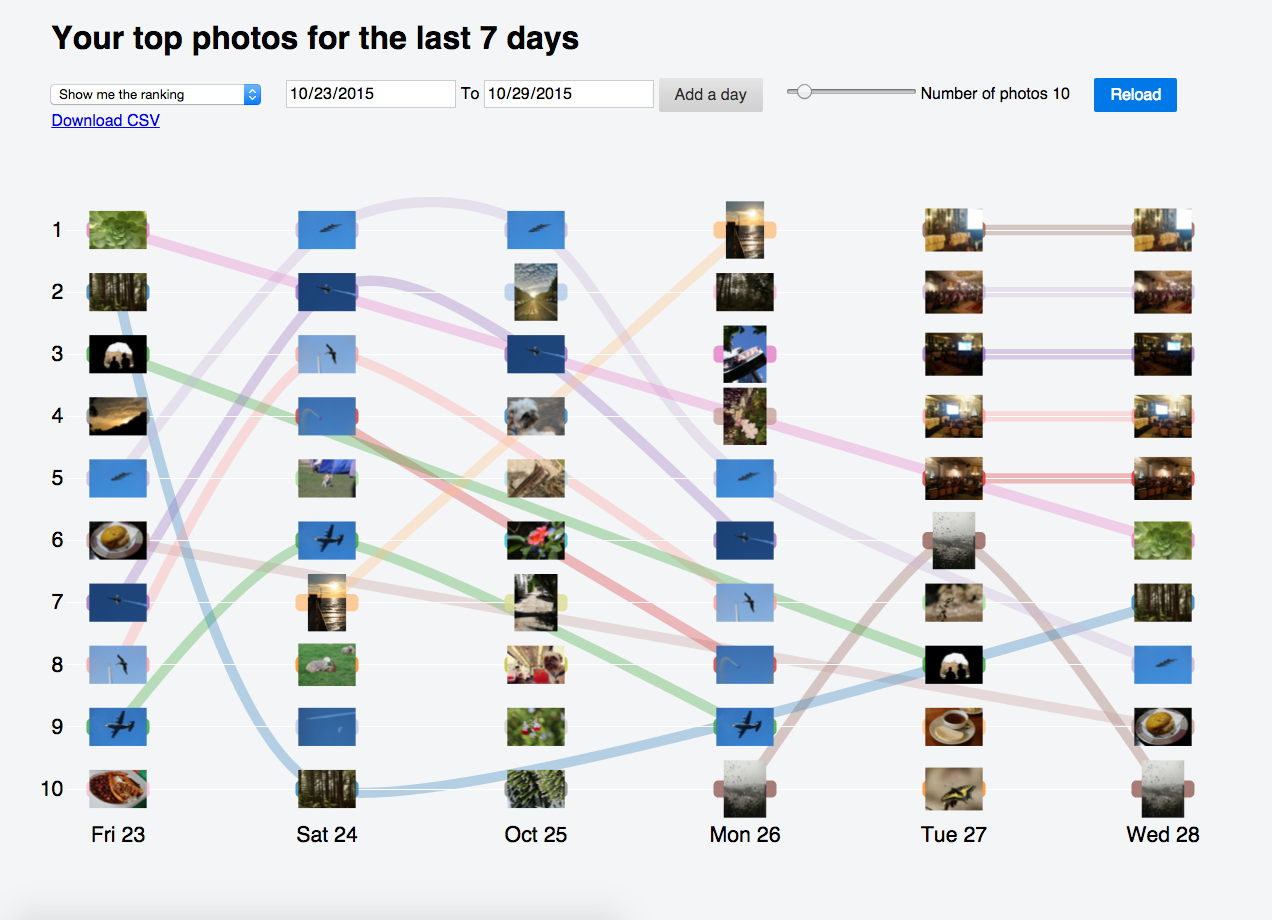
Photo Ranking
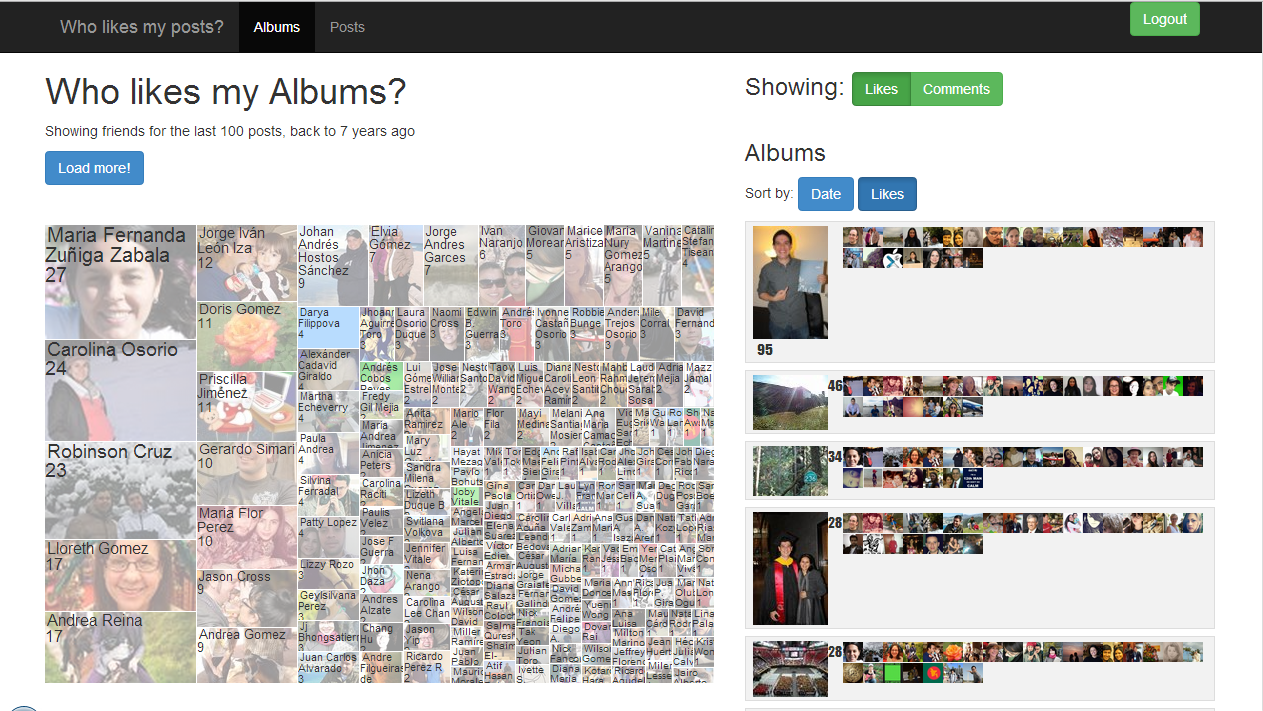 http://Wholikesmyfb.com
BTactile
How to better enable people to support blind students in learning graphics


