The quest for insights,
the true objective of big data
John Alexis Guerra Gómez
@duto_guerra
Use spacebar and the arrows to advance slides
http://johnguerra.co/viz/bigDataQuest

Outline
- Who am I?
- What is Big Data?
- How to process/store it?
- How to make sense of it?
Who am I?

PhD


Silicon Valley


What is Big Data?
You might have heard of the Vs of Big Data
- Volume
- Velocity
- Variety
- and Veracity and Value
- Too ambiguous!! Let's go beyond that
How Big is big?
Can you fit it in one computer?
Yes? -> Then is not really big
Let's call it big data only if it doesn't fit on one computer (and has the 3Vs)
Why this criteria?
Because if it fits in one computer you don't need all the overhead of big data technologies, just use a traditional relational database.


Example: photo collection
- One photo -> 10MB
- 1k photos in a cellphone -> 10MB * 1k = 10000MB = 10GB
- 50k photos in your computer -> 10MB * 50k = 500GB
- Is that big data?
- No, you can fit that in one cheap external hard drive
Problem: count how many blue photos in my collection?
How do you compute this?
Put all your photos in one computer
Go through all the collection and count

Flickr size
80+ trillion photos (80'''000''000'000.000)
That's big data
How many blue photos on Flickr?
How do you compute this?
Distribute the data among hundreds of thousand of computers (a cluster).
Compute subtotals on each chunk of the data. (Map)
Aggregate the subtotals into one big total. (Reduce)


How many computers do you need?
total / one computer capacity?
What if one computer breaks down?
We need redundancy -> Each photo is stored in many computers
How do we control versions? How to keep records? What goes where?
That's why we need big data!!

Technologies
- MapReduce (Hadoop, Hive, pig, Spark ...)
- NoSQL Databases (Redis, Cassandra, MongoDB, Neo4J)
- Distributed Relational (SQL) Databases (MySQL, PostgreSQL, Oracle, SqlServer)
- Many others
Hadoop
- Computing platform for big data
- Uses clusters for storing and processing the data
Hadoop Architecture

Spark
A distributed computing alternative of to map reduce.
- Easier to use
- Integrates better with traditional programming models
NoSQL Databases
- Scalable storage platforms that use techniques different to traditional SQL databases
- Sacrifices features for performance
Types of NoSQL
- Column Oriented: Cassandra, HBase, Redshift ...
- Key-value: Redis, memcached, Aerospike ....
- Document based: MongoDB, CouchDB, DynamoDB ...
- Graph based: Neo4J, Titan, ...
Bonus
Distributed Relational DB
- You can also use traditional databases on a distributed way.
- Divides the database into shards.
- Usually doesn't scale that well.
Others
- Google DataFlow
- Google's replacement for MapReduce based on flows.
- Supposed to scale better.
- AFAIK can only be used with Google's Cloud.
Making sense
How to make sense of it?
- Statistical Analysis
- Machine Learning and Artificial Intelligence
- Visual Analytics (and data analytics)
Data Mining/Machine Learning

Information Visualization

Infovis + Algorithms

Traditional
Pros:
Cons:
|
Data Mining/ML
Pros:
Cons:
|
InfoVis
Pros:
Cons
|
Why should we visualize?
Anscombe's quartet
| I | II | III | IV | ||||
|---|---|---|---|---|---|---|---|
| x | y | x | y | x | y | x | y |
| 10.0 | 8.04 | 10.0 | 9.14 | 10.0 | 7.46 | 8.0 | 6.58 |
| 8.0 | 6.95 | 8.0 | 8.14 | 8.0 | 6.77 | 8.0 | 5.76 |
| 13.0 | 7.58 | 13.0 | 8.74 | 13.0 | 12.74 | 8.0 | 7.71 |
| 9.0 | 8.81 | 9.0 | 8.77 | 9.0 | 7.11 | 8.0 | 8.84 |
| 11.0 | 8.33 | 11.0 | 9.26 | 11.0 | 7.81 | 8.0 | 8.47 |
| 14.0 | 9.96 | 14.0 | 8.10 | 14.0 | 8.84 | 8.0 | 7.04 |
| 6.0 | 7.24 | 6.0 | 6.13 | 6.0 | 6.08 | 8.0 | 5.25 |
| 4.0 | 4.26 | 4.0 | 3.10 | 4.0 | 5.39 | 19.0 | 12.50 |
| 12.0 | 10.84 | 12.0 | 9.13 | 12.0 | 8.15 | 8.0 | 5.56 |
| 7.0 | 4.82 | 7.0 | 7.26 | 7.0 | 6.42 | 8.0 | 7.91 |
| 5.0 | 5.68 | 5.0 | 4.74 | 5.0 | 5.73 | 8.0 | 6.89 |
| Property | Value |
|---|---|
| Mean of x | 9 |
| Variance of x | 11 |
| Mean of y | 7.50 |
| Variance of y | 4.125 |
| Correlation between x and y | 0.816 |
| Linear regression | y = 3.00 + 0.500x |
| Coefficient of determination of the linear regression | 0.67 |
Anscombe's visualized

More examples same stats
 https://dabblingwithdata.wordpress.com/2017/05/03/the-datasaurus-a-monstrous-anscombe-for-the-21st-century/
Datasaurus!
 https://dabblingwithdata.wordpress.com/2017/05/03/the-datasaurus-a-monstrous-anscombe-for-the-21st-century/
In Infovis we look for Insights
- Deep understanding
- Meaningful
- Non obvious
- Actionable
How do I do it?

What do I use?

Insights
FDA
Task: Change in drug's adverse effects reports
User: FDA Analysts
State of the art


 https://treeversity.cattlab.umd.edu/
Health insurance claims
Task: Detect fraud networks
User: Undisclosed Analysts

Clustering
Overview

Ego distance

Who to follow on Twitter
http://johnguerra.co/slides/untanglingTheHairball/#/Twitter Influentials
Task: Who are the most interesting people to follow on #OpenvisConf
User: Conference attendants
Well, you could follow all the people that mentions #OpenvisConf
- 3000+ Tweets
- 784 Accounts
What about the interesting people that didn't talk #OpenvisConf during the conference?
What about only the people followed the most by the people that talk #OpenVisConf?
Let's visualize it!
- D3!
- Networks!
State of the art netviz

Filter 300!

Only influentials!

Communities

Back to my question!
Let's fix axis
Number of followers overall vs followers in #OpenVisConf
Links on demand
Add back more nodes
Number of tweets
Tweetometro
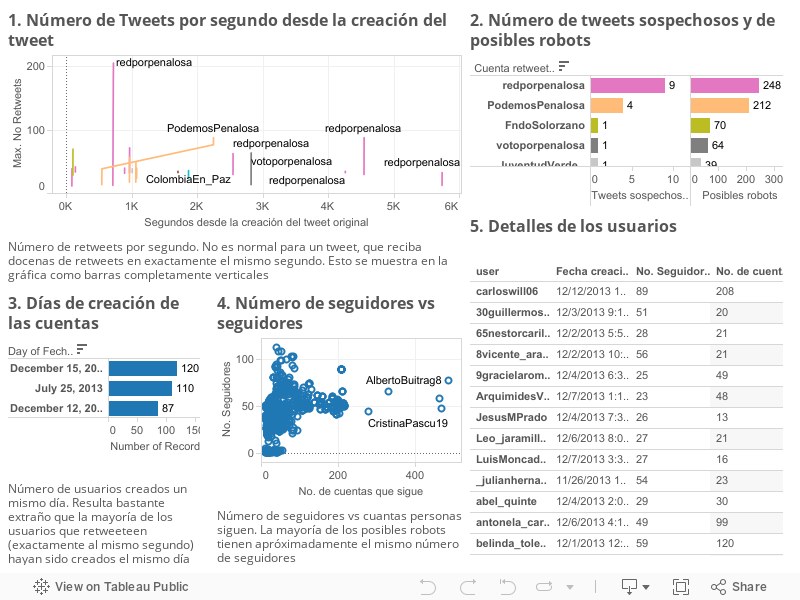
Task: Twitter behavior during Presidential Elections
User: Me
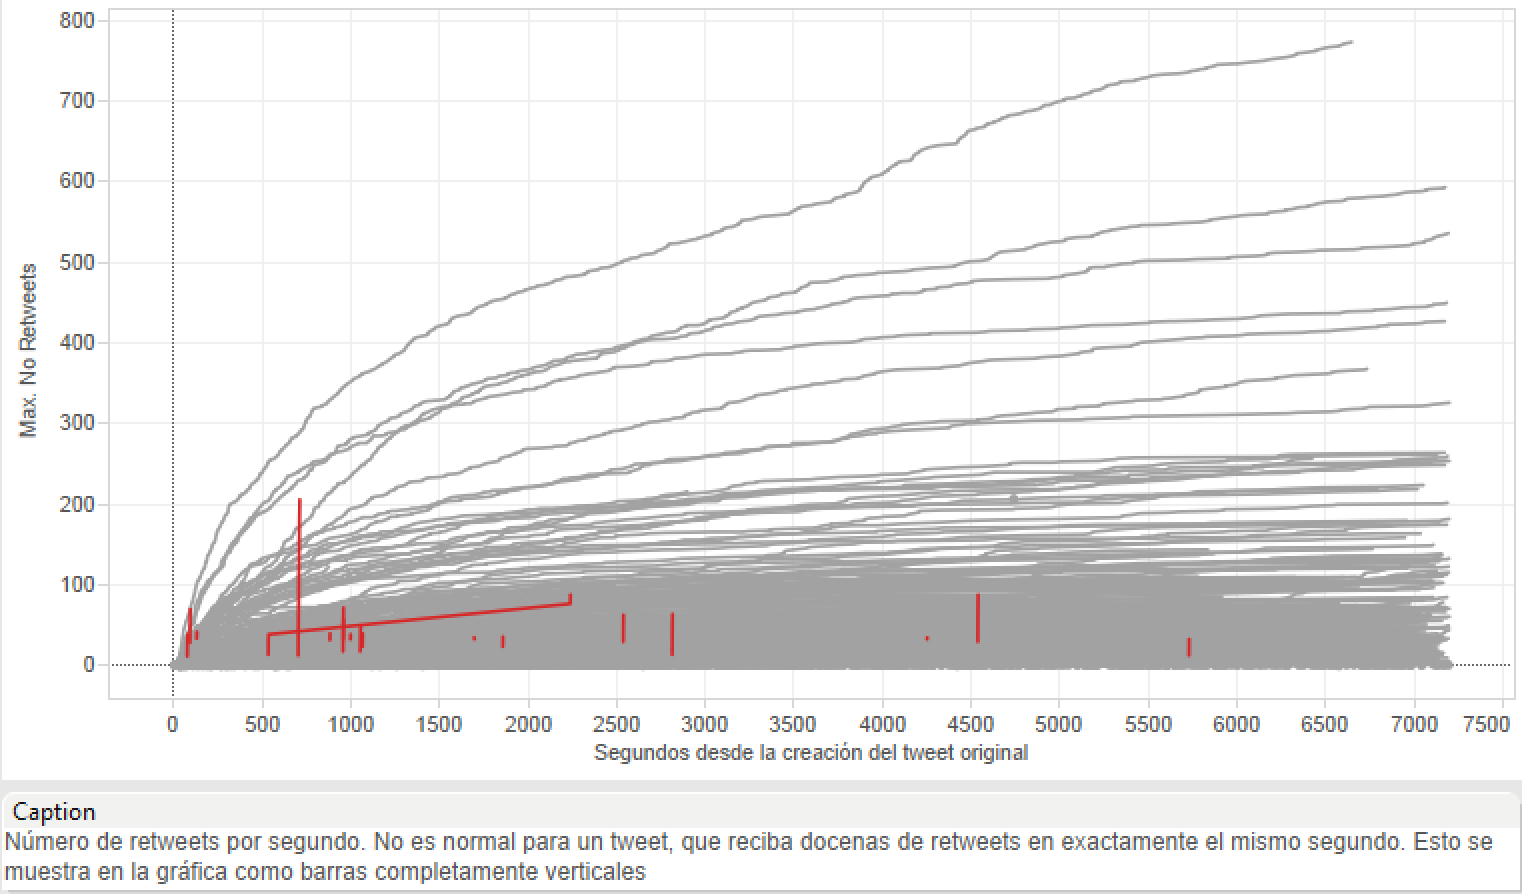
Normal tweets
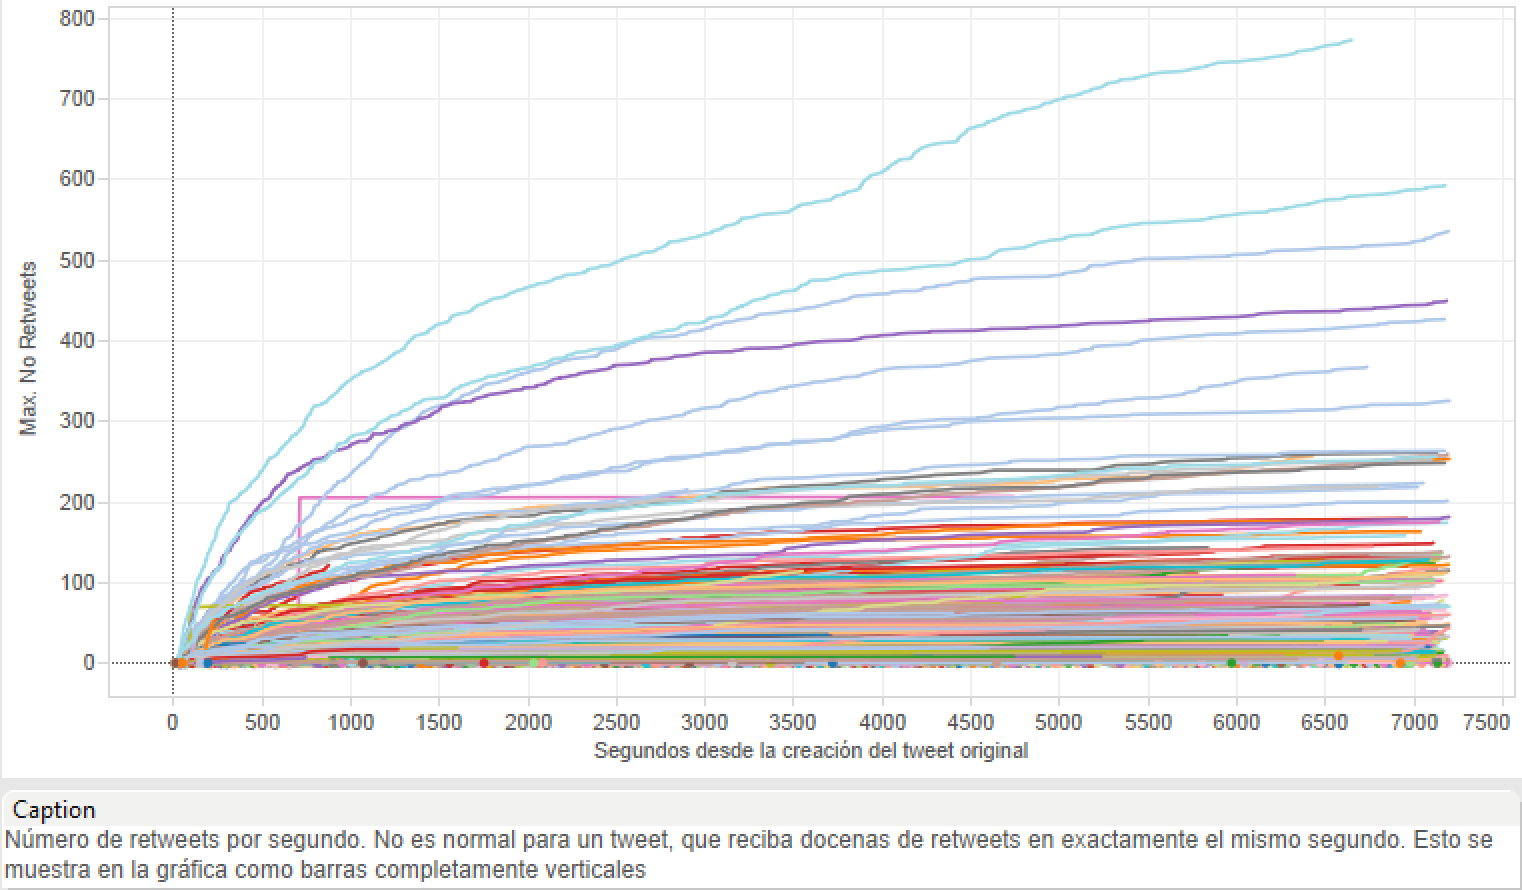
Weird tweets?
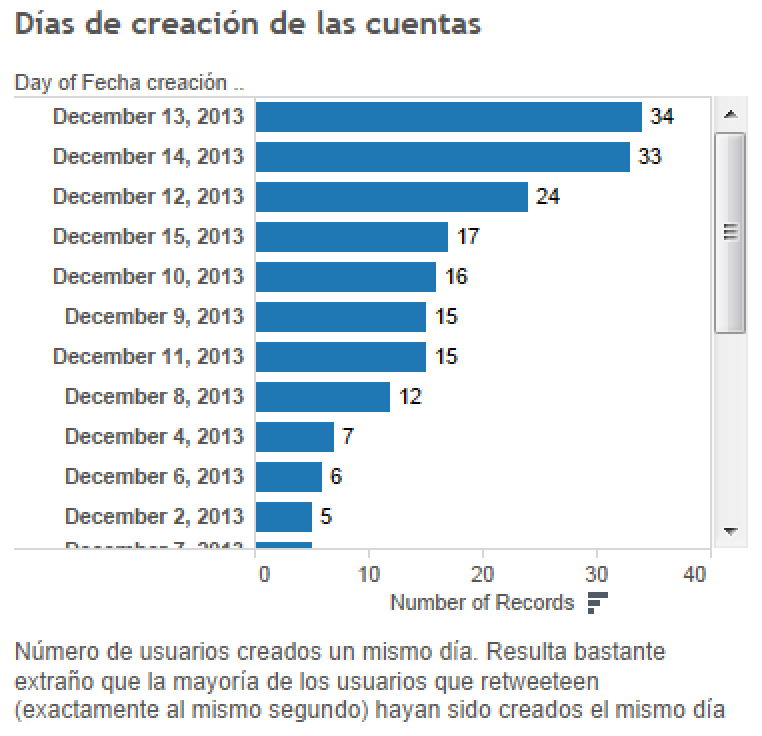
Creation dates
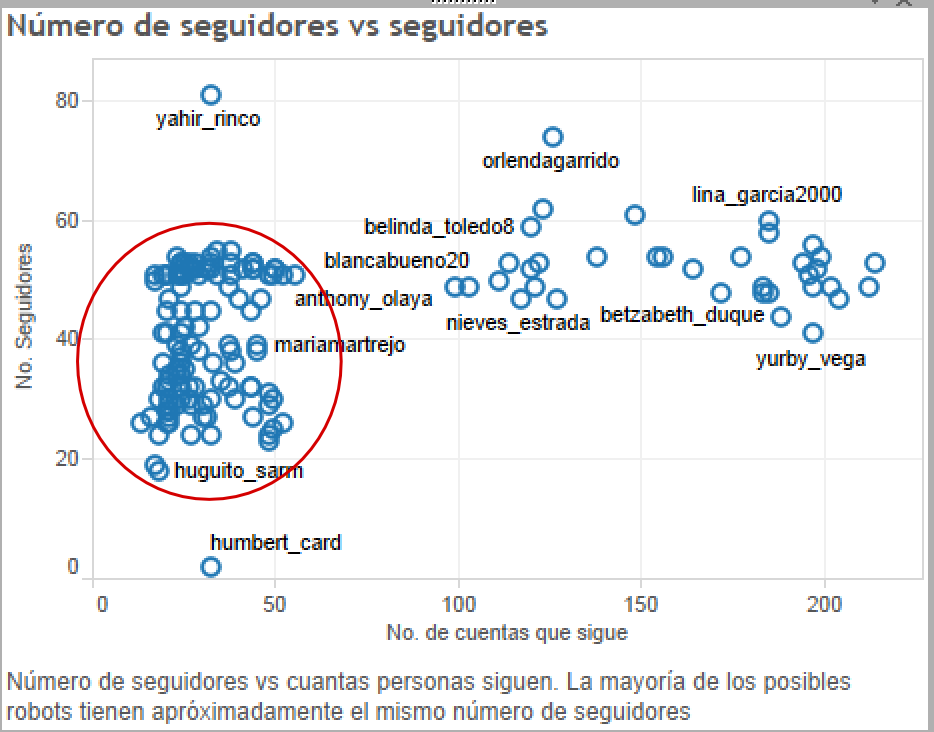
Number of followers
What car to buy?
Task: What's the best car to buy?
User: Me
Normal procedure
Ask friends and family
Problem
That's inferring statistics from a sample n=1
Better approach
Data based decisions
 http://tucarro.com
Take home message
- Big data? Sure, If it doesn't fit on a computer
- Finding insights, that's what matters
- Visual Analytics, a good way of finding insights
Thank You
Questions?
Bonus
Types of Visualization
- Infographics
- Scientific Visualization (sciviz)
- Information Visualization (infovis, datavis)
Infographics

Scientific Visualization
- Inherently spatial
- 2D and 3D

Information Visualization

Infovis Basics
Visualization Mantra
- Overview first
- Zoom and Filter
- Details on Demand
Perception Preference
Adapted from from:Tamara Munzner Book Chapter
Data Types
| 1-D Linear | Document Lens, SeeSoft, Info Mural |
| 2-D Map | GIS, ArcView, PageMaker, Medical imagery |
| 3-D World | CAD, Medical, Molecules, Architecture |
| Multi-Var | Spotfire, Tableau, GGobi, TableLens, ParCoords, |
| Temporal | LifeLines, TimeSearcher, Palantir, DataMontage, LifeFlow |
| Tree | Cone/Cam/Hyperbolic, SpaceTree, Treemap, Treeversity |
| Network | Gephi, NodeXL, Sigmajs |