The quest for insights,
the true objective of big data
John Alexis Guerra Gómez
@duto_guerra
http://johnguerra.co/viz/bigDataQuestSU

Use spacebar and the arrows to advance slides
Big Data?
You might have heard of the Vs of Big Data
- Volume
- Velocity
- Variety
- and Veracity and Value
Too ambiguous!! 🤦🏽♀️ Let's go beyond that
How Big is big?
Can you fit it in one computer?
Yes? 👉🏼 Then, is not really big 🤷🏽♀️
Why this criteria?
Big data 👉🏼 Big overhead
Example: photo collection
- One photo 👉🏼 10MB
- 1k photos in a 📱 👉🏼 10MB * 1k = 10000MB = 10GB
- 50k photos in your 💻 👉🏼 10MB * 50k = 500GB
Big Data? 🙅🏽♂️
How many blue photos are in my collection?
How do you compute this?
- Put all your photos in one 💻
- Go through all the collection and count the blue ones
Flickr scale
80+ trillion photos (80'''000''000'000.000)
That's big data
How many blue photos are on Flickr?
How do you compute this?
- Distribute the data among 100s of 💻💻💻s. (a cluster)
- Compute subtotals on each data part. (Map)
- Aggregate the subtotals into one big total. (Reduce)
How many computers do you need?
What if one computer breaks? ☢️
Conclusion
Big Data? 👉🏼 Only if it doesn't fit on one 💻
⚠️ Use it only if you must ⚠️
But don't panic!
Let me share a secret
🤫
My wife tells it to me all the time!
Size doesn't really matter
What matters are the insights 👍
Insights ?
Making Sense of Data
How to make sense of data?
- Statistical Analysis
- Machine Learning and Artificial Intelligence
- Visual Analytics (and data analytics)
Why should we visualize?
| I | II | III | IV | ||||
|---|---|---|---|---|---|---|---|
| x | y | x | y | x | y | x | y |
| 10.0 | 8.04 | 10.0 | 9.14 | 10.0 | 7.46 | 8.0 | 6.58 |
| 8.0 | 6.95 | 8.0 | 8.14 | 8.0 | 6.77 | 8.0 | 5.76 |
| 13.0 | 7.58 | 13.0 | 8.74 | 13.0 | 12.74 | 8.0 | 7.71 |
| 9.0 | 8.81 | 9.0 | 8.77 | 9.0 | 7.11 | 8.0 | 8.84 |
| 11.0 | 8.33 | 11.0 | 9.26 | 11.0 | 7.81 | 8.0 | 8.47 |
| 14.0 | 9.96 | 14.0 | 8.10 | 14.0 | 8.84 | 8.0 | 7.04 |
| 6.0 | 7.24 | 6.0 | 6.13 | 6.0 | 6.08 | 8.0 | 5.25 |
| 4.0 | 4.26 | 4.0 | 3.10 | 4.0 | 5.39 | 19.0 | 12.50 |
| 12.0 | 10.84 | 12.0 | 9.13 | 12.0 | 8.15 | 8.0 | 5.56 |
| 7.0 | 4.82 | 7.0 | 7.26 | 7.0 | 6.42 | 8.0 | 7.91 |
| 5.0 | 5.68 | 5.0 | 4.74 | 5.0 | 5.73 | 8.0 | 6.89 |
| Property | Value |
|---|---|
| Mean of x | 9 |
| Variance of x | 11 |
| Mean of y | 7.50 |
| Variance of y | 4.125 |
| Correlation between x and y | 0.816 |
| Linear regression | y = 3.00 + 0.500x |
| Coefficient of determination of the linear regression | 0.67 |


https://dabblingwithdata.wordpress.com/2017/05/03/the-datasaurus-a-monstrous-anscombe-for-the-21st-century/
Datasaurus!

https://dabblingwithdata.wordpress.com/2017/05/03/the-datasaurus-a-monstrous-anscombe-for-the-21st-century/
In Infovis we look for Insights
- Deep understanding
- Meaningful
- Non obvious
- Actionable
- Based on data
How do I do it?

What do I use?

Insights
What car should I buy?
Normal procedure
Ask friends and family
Problem
That's inferring statistics from a sample n=1
Better approach
Data based decisions

http://tucarro.com
Twitter election analysis
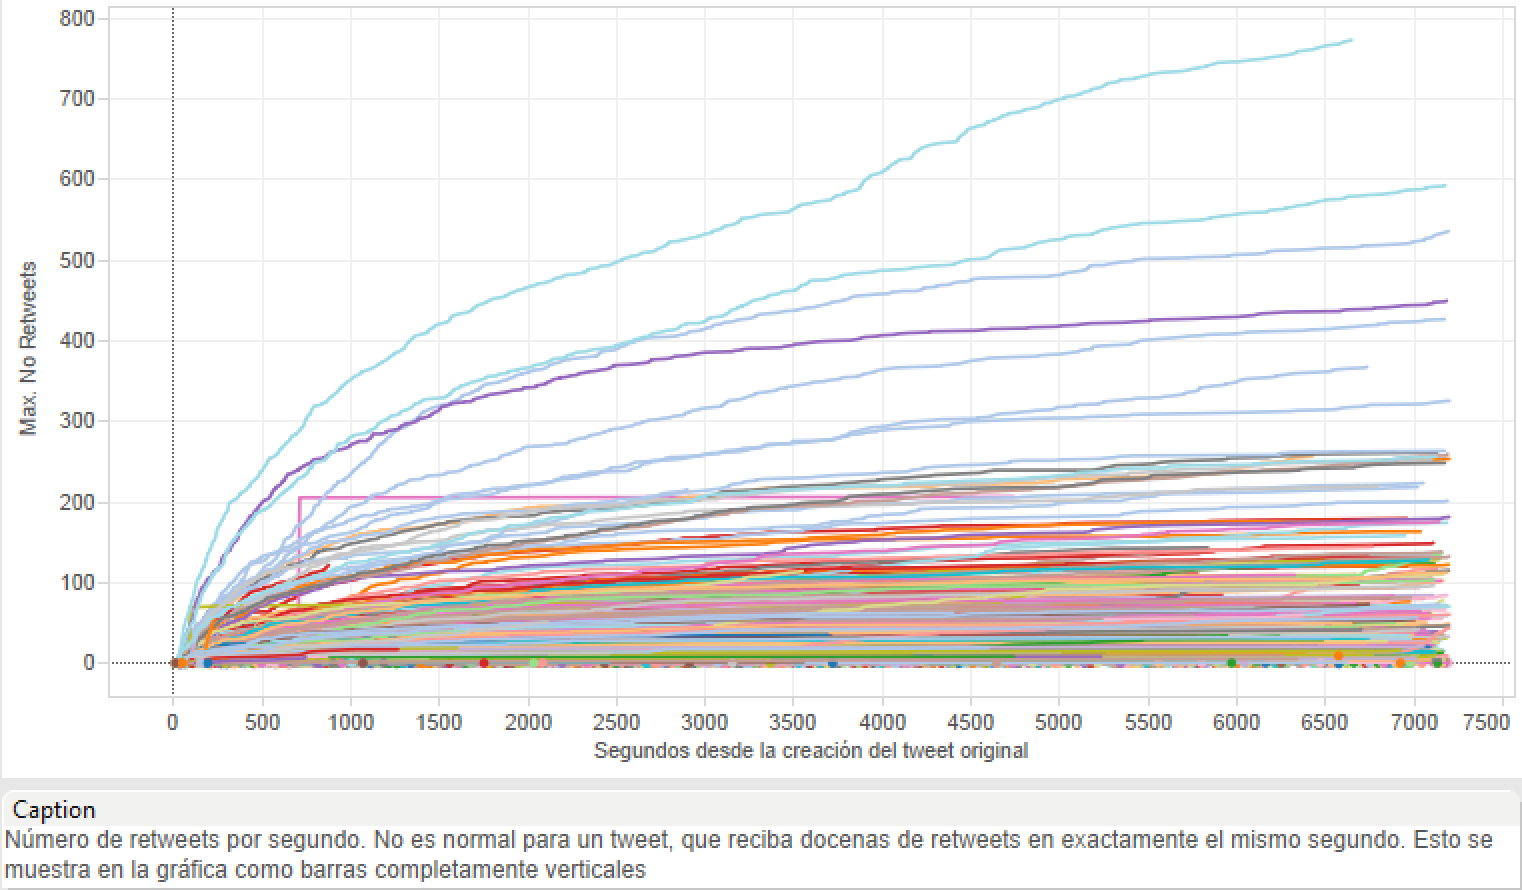
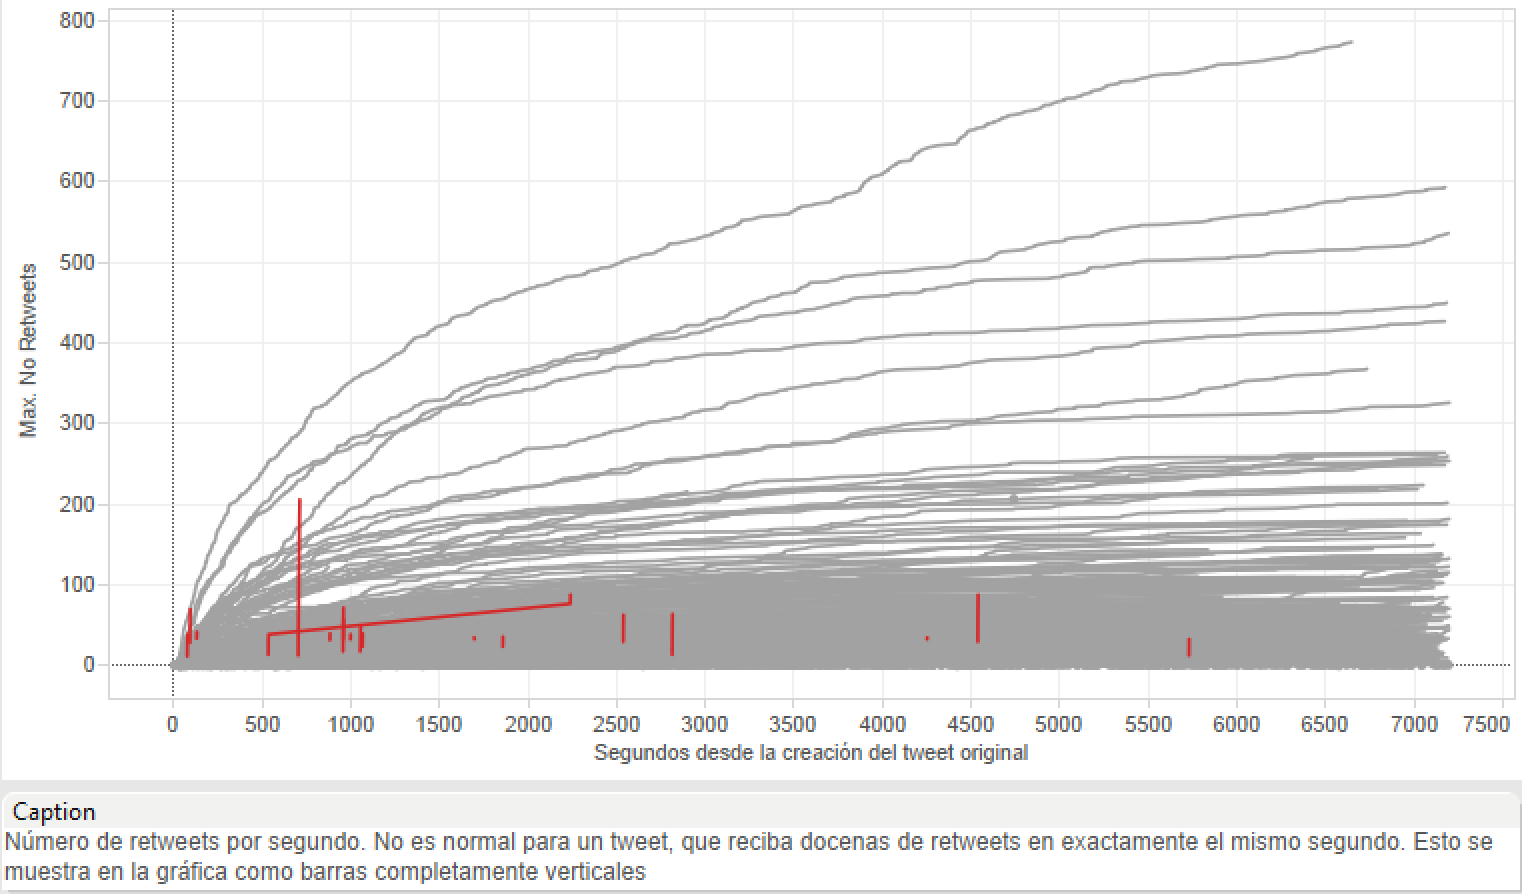
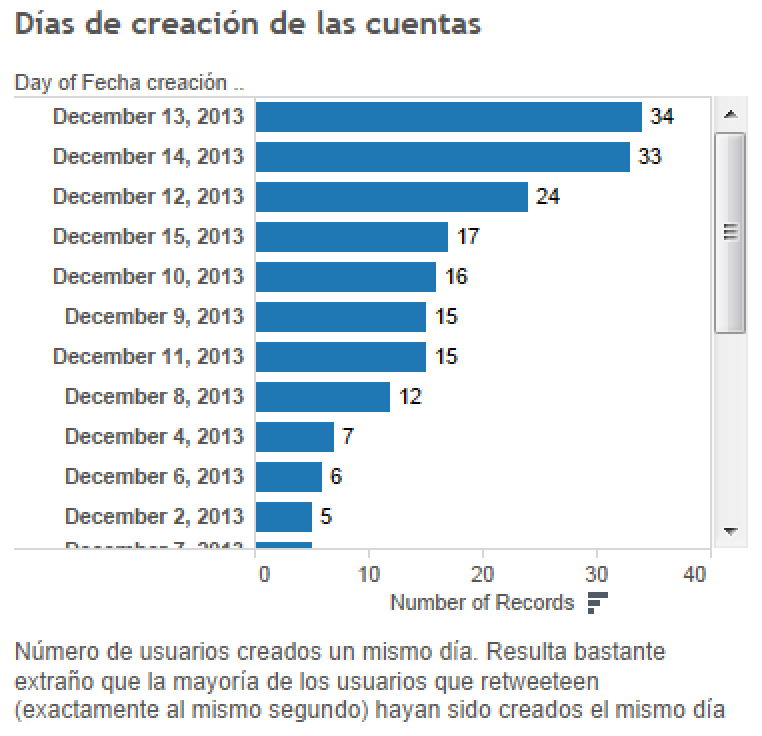
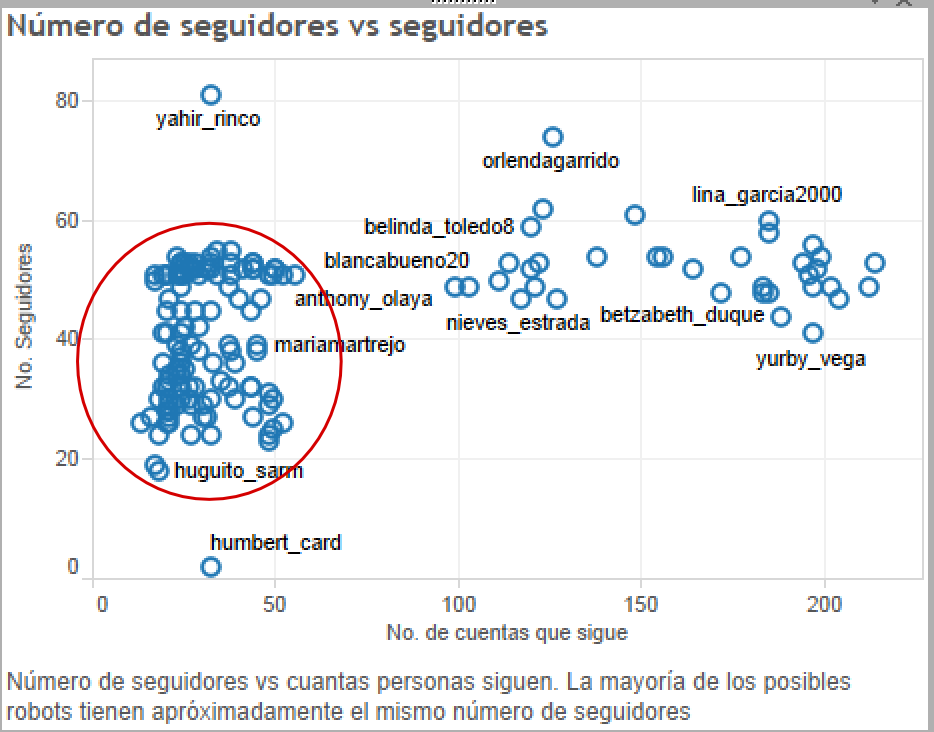
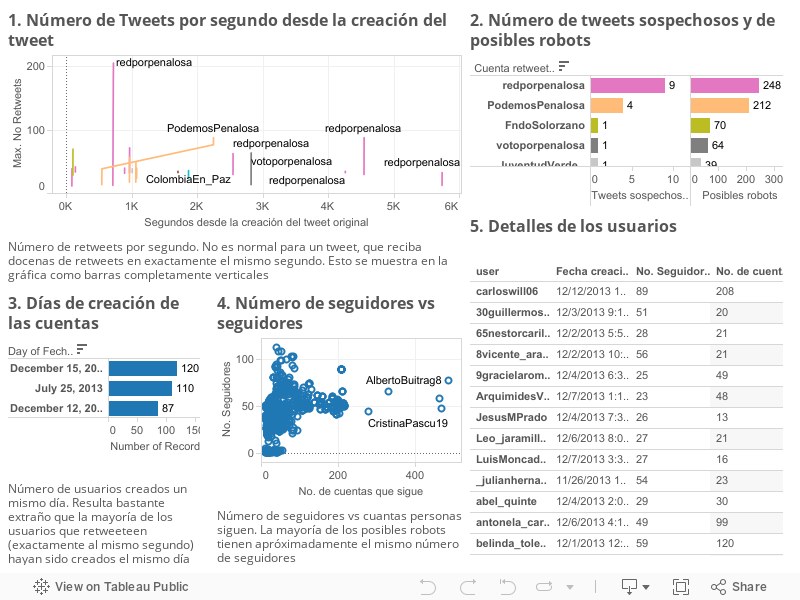
Presidential Election
Anti-corruption referendum
What about industry?
How do our Senators vote?
Take home messages
Big Data?
Sure, If it doesn't fit on a computer
Focus on insights!!!
Size doesn't matter
We need more open data!

http://johnguerra.co/viz/saber11/
How can I get Insights too?
No need to wait for Stanford, MIT or Berkeley to help you
IMAGINE Research Group
- Visual Analytics
- Virtual/Augmented Reality
- Visual Computing
- Mobile Robotics
- Machine Learning
Visit our booth!


Remember
- Size doesn't matter
- 👉🏼 Insights! 👈🏼
- Open data and share
- Ask for infovis
Bonus
Other Insights
FDA
Task: Change in drug's adverse effects reports
User: FDA Analysts
State of the art


 https://treeversity.cattlab.umd.edu/
Health insurance claims
Task: Detect fraud networks
User: Undisclosed Analysts

Clustering
Overview

Ego distance

Who to follow on Twitter
http://johnguerra.co/slides/untanglingTheHairball/#/Types of Visualization
- Infographics
- Scientific Visualization (sciviz)
- Information Visualization (infovis, datavis)
Infographics

Scientific Visualization
- Inherently spatial
- 2D and 3D

Information Visualization

Infovis Basics
Visualization Mantra
- Overview first
- Zoom and Filter
- Details on Demand
Data Types
| 1-D Linear | Document Lens, SeeSoft, Info Mural |
| 2-D Map | GIS, ArcView, PageMaker, Medical imagery |
| 3-D World | CAD, Medical, Molecules, Architecture |
| Multi-Var | Spotfire, Tableau, GGobi, TableLens, ParCoords, |
| Temporal | LifeLines, TimeSearcher, Palantir, DataMontage, LifeFlow |
| Tree | Cone/Cam/Hyperbolic, SpaceTree, Treemap, Treeversity |
| Network | Gephi, NodeXL, Sigmajs |