John Alexis
Guerra Gómez
I do Visual Analytics, i.e., I include the user in the big data analysis/science loop.
john.guerra[~at~]gmail.comjohnguerra.co
PDF Version
Follow @duto_guerra
In a nutshell
Information Visualization Researcher and Engineer. I help people extract insights from their data using interactive infovis and data science. PhD in Computer Science, Assistant Teaching Professor at Northeastern University Bay Area. I conduct research on Visual Analytics, Accessibility, Big data, Human Computer Interaction and Web Development. Formerly at UCBerkeley, Uniandes Colombia, Yahoo Labs, Xerox PARC and DUTO .
Experience
- 10 years as a researcher in Information Visualization. Portfolio
- 17 years as a full stack engineer
- 11 years on teaching at university level
- 30+ research publications at major conferences such as CHI, IEEEVIS, AVI, TRB
- Part of the Program Committee of toCHI 2016, Creativity and Cognition 2017/2018/2019, Graph Drawing 2017. Reviewer for CHI, IEEEVIS, AVI, EuroVis and UIST
- 15 years as public speaker.
- Entrepreneur co-founder of DUTO, KebSolutions, Tweetometro.co and BTactile, with more than 10 international entrepreneurship awards
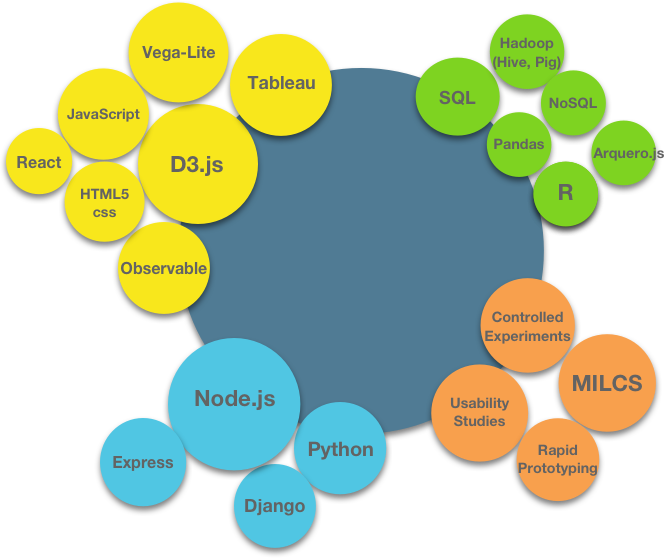
My Skills
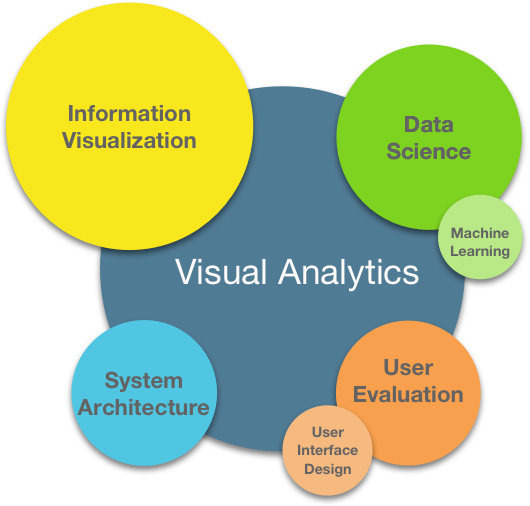
The tools and techniques I use
Experience and Education

- Conducting research in information visualization and accesibility.
- Teaching: Web Development, Database Management Systems and Information Visualization.

- Conducted research in large dataviz, network visualization and photo visualization and accessibility, with the help of great students.
- Redesigned and taught the Visual Analytics (Fall '18, Fall '17, Fall '16) and Web Development classes (Fall '18, Spring '18, Spring '17, Fall '17).

- Course co-designer, course coordinator, and remote lecturer at Berkeley's online Master in Data Science. Teaching W209 Data Communication and Visualization.
- Completely redesigned the course materials to include the Visual Analytics theory fundamentals, and D3, Vega-Lite, and Tableau Practice. In collaboration with Andy Reagan
- Published a series of videos on how to go from Visualization theory to practice
- Student projects: Summer 2020, Spring 2020, Fall 2019, Fall 2018, Spring 2018, Summer 2017, Fall 2017.

- Explored information visualization interfaces for navigating big repositories of photos.
- Helped redesign Flickr stats.
- Developed and deployed a visualization for better exploring the organizational units that is being used company wide.
- Modified Flickr code to add a new photo navigation visualization.
- Four papers accepted in two major conferences (CHI2016 and AVI2016).
- Created visual analytics for dozens of complex Yahoo datasets.

- Created Network Explorer a visual network analytics tool to explore hundreds of thousands of nodes, which was implemented, among others, in a Fraud, Waste and Abuse solution from Xerox and is being used for detecting fraud in Health Care networks.
- Constructed several dashboards using Tableau.
- Developed and integrated several other time-based and text based visualizations in 3 different products.

- Co-founded and developed BTactile a platform to index 5000 tactile graphics for the blind from all over the world using Meteor.js and React.
- OpenVis 2017 Speaker with Untangling the Hairball, slides.
- Creator of open source software: RevealVizScroll, force-in-a-box, netClustering.js, navio.
- Co-creator of tweetometro.co a platform to monitor Twitter activity for the Colombian presidential election.

- PhD and MSc in Computer Science under the supervision of Dr. Ben Shneiderman and Dr. Catherine Plaisant at the University of Maryland (2013).
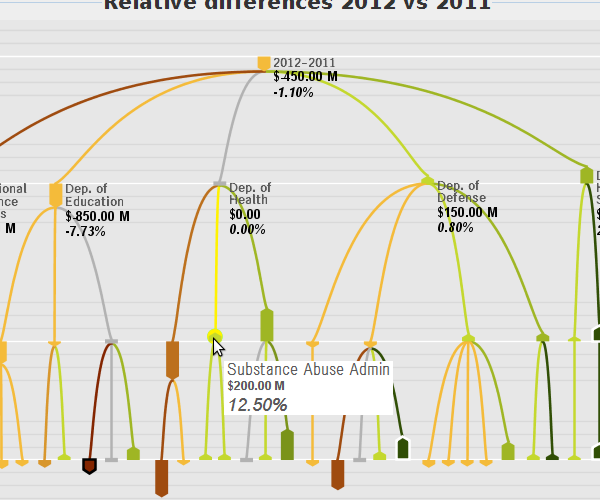
- Created the StemView a visualization technique that represents 5 characteristics of change in trees.
- Created the Bullet a visualization glyph that represents 4 characteristics of change in trees.
- Implemented TreeVersity2 a visual analytics web application to explore change in datasets over time.
- Implemented TreeVersity a visual analytics desktop application to compare changes between two trees.
- Conducted 13 case studies with 9 domain experts to validate TreeVersity and TreeVersity2.

- Winner of the Fulbright Science and Technology scholarship (40 people awarded in the world yearly).
- Lecturer in a wide range of undergrad courses from Programming to Distributed Systems.

- Co-founder of DUTO and Co-creator of IRIS a system that allows blind students to see with their hands.
- CTO and responsible of all the software development in the company.
- Winner of more than 10 international entrepreneurship awards.
Academic contributions
Things I have built
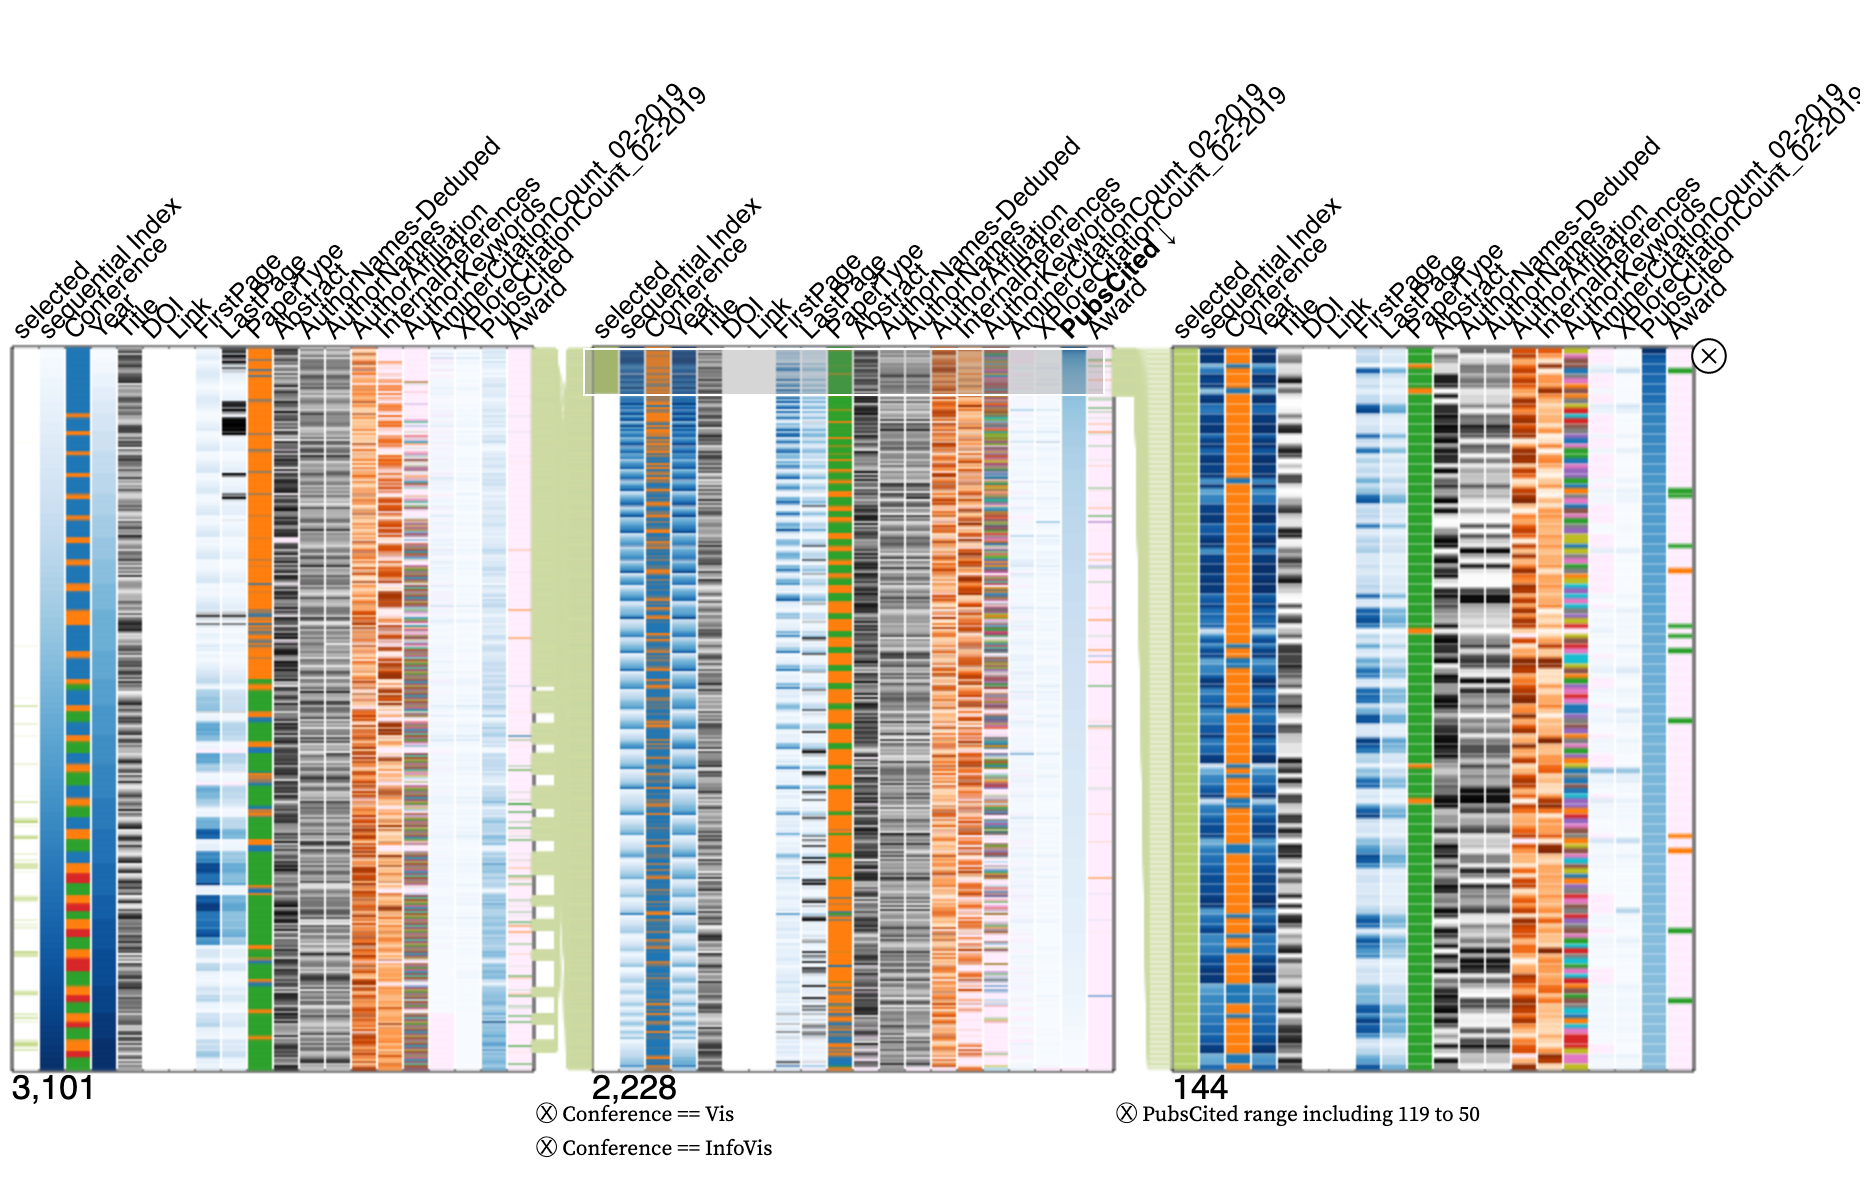
Navio
A visualization widget that you can use to explore large data
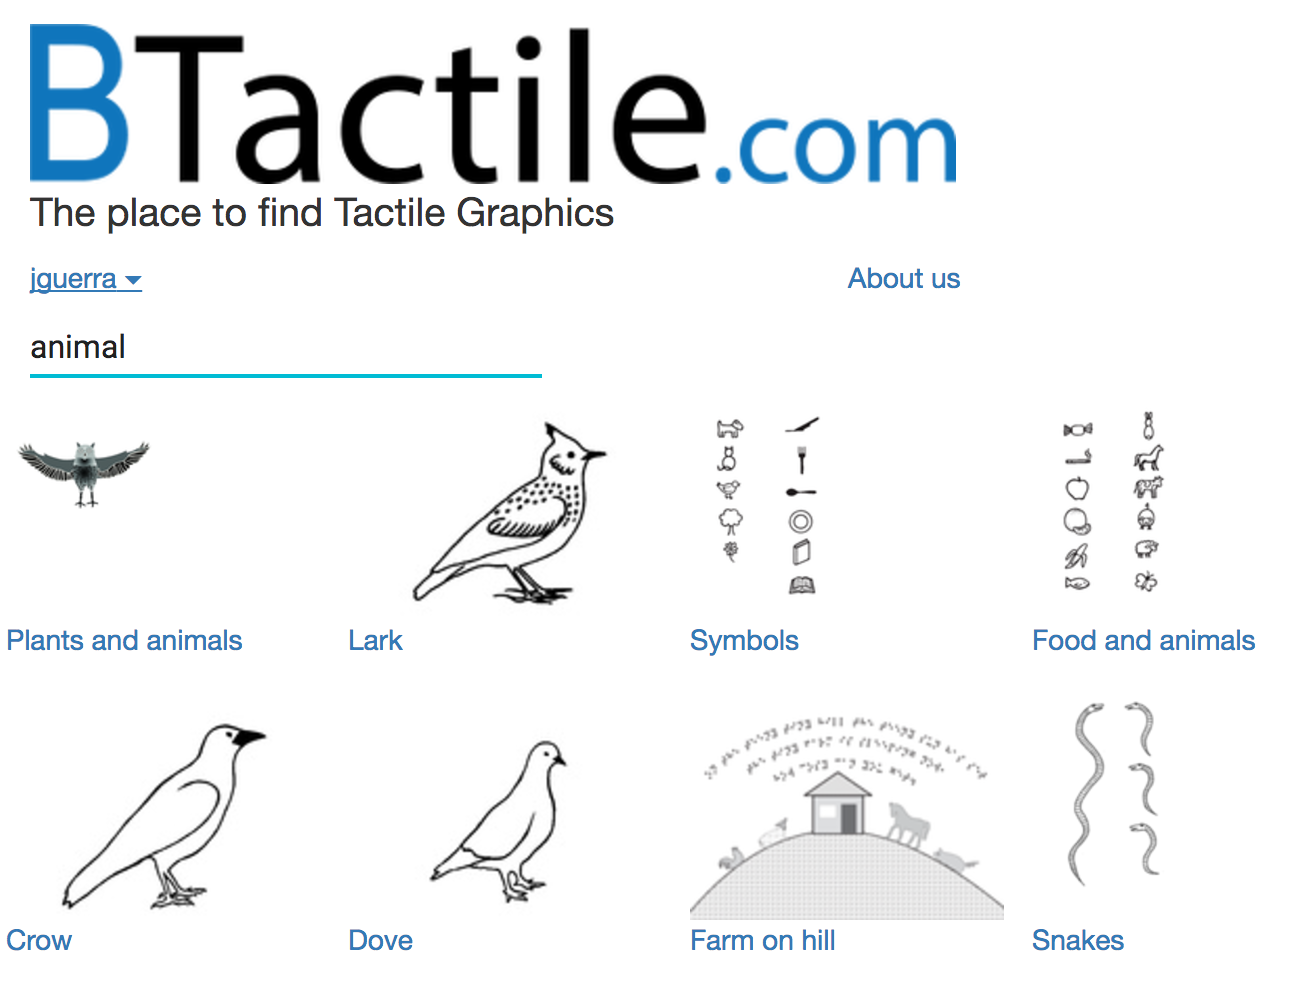
BTactile
A search engine for tactile images for the blind.
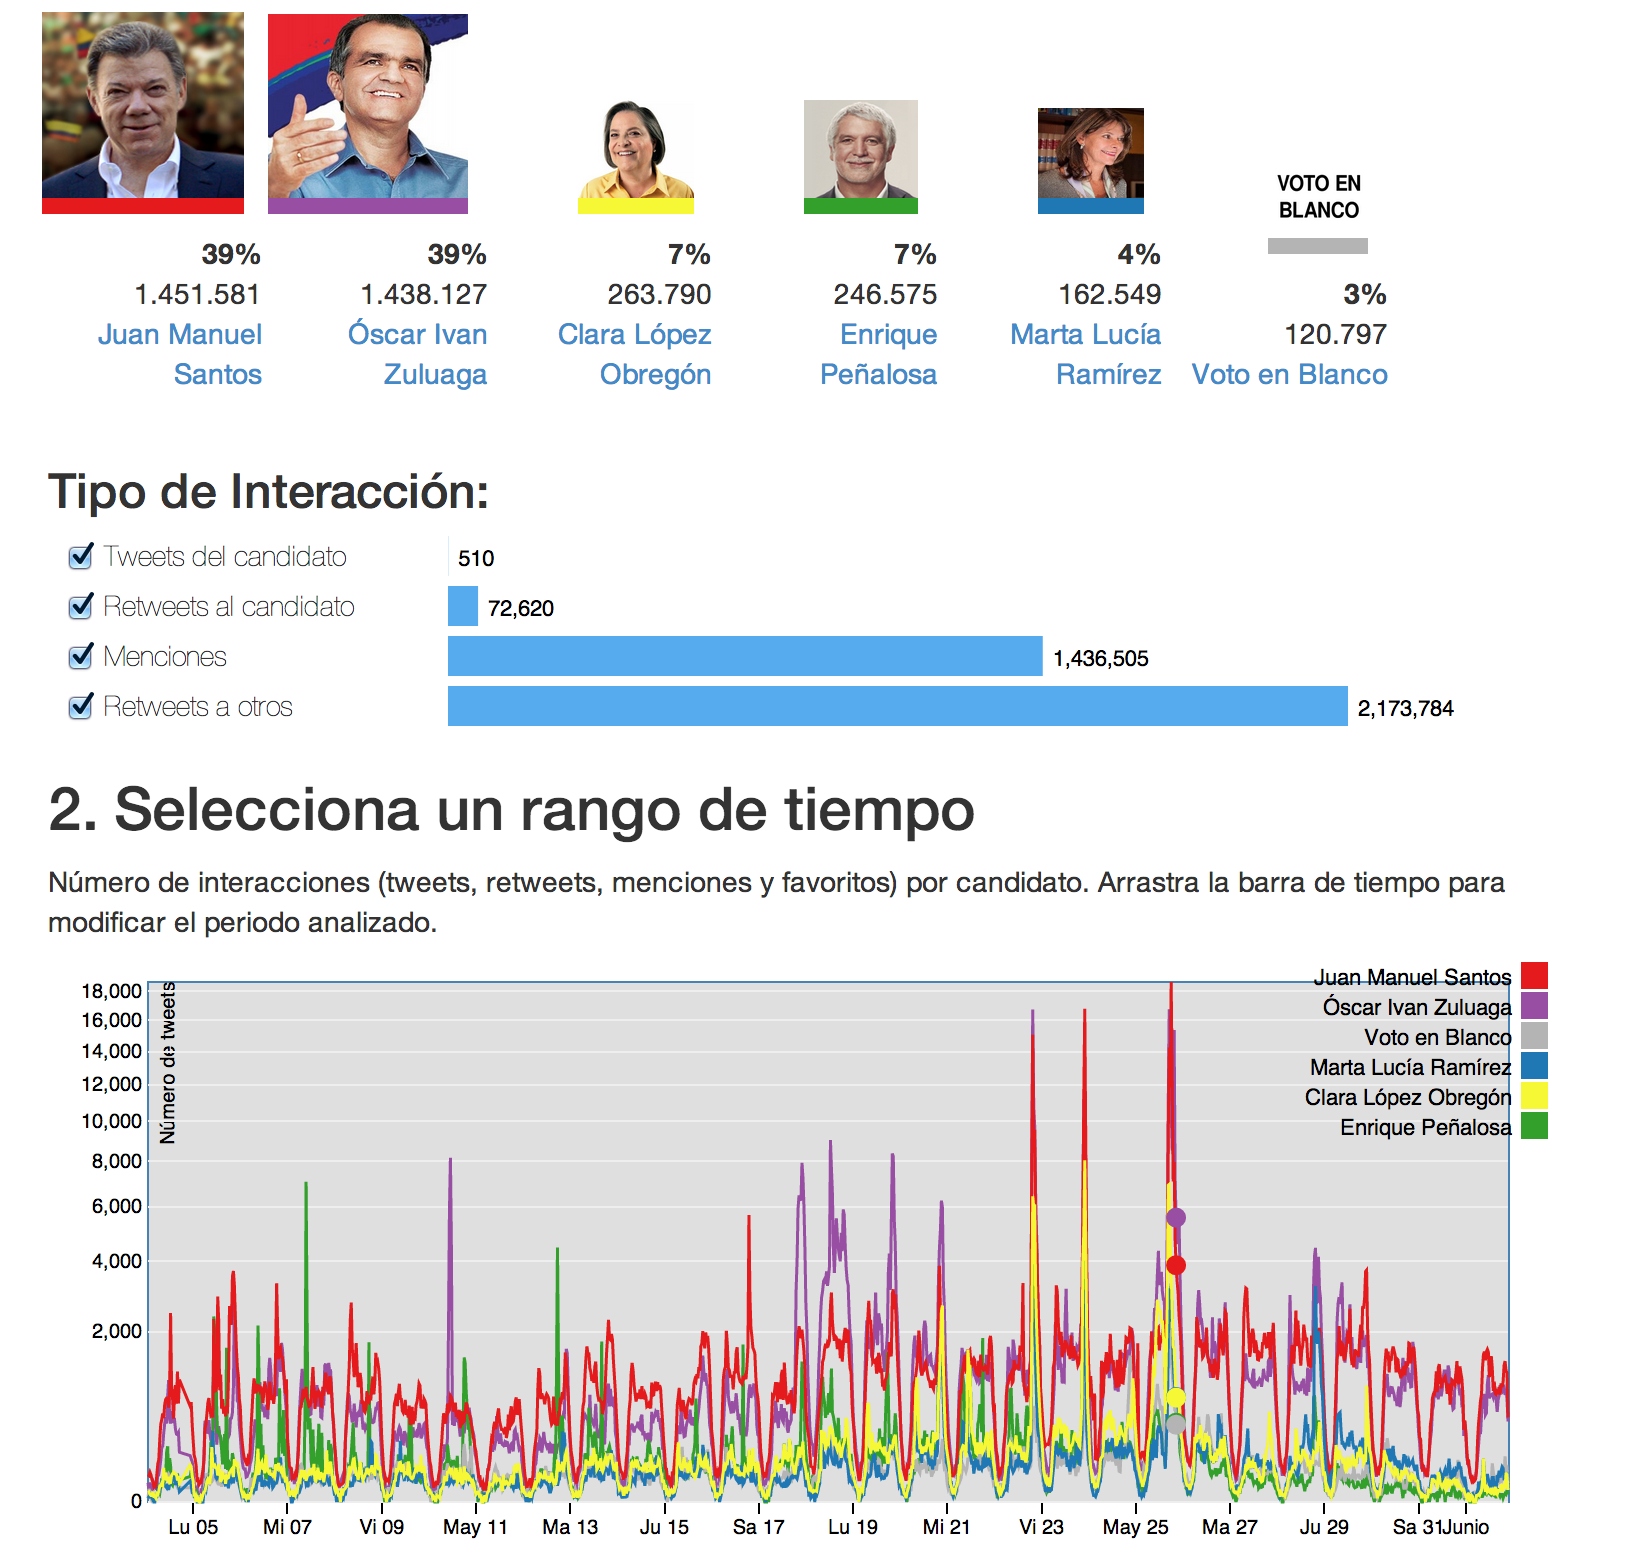
Tweetometro
Twitter monitor and analyzer for different topics
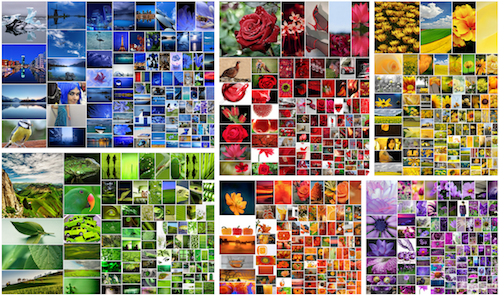
Phototreemap
Representing groups of photos with numeric attributes. Work in progress, pending publication.
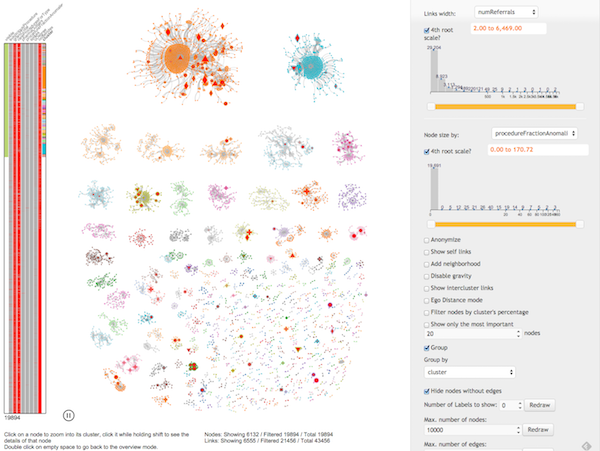
Network Explorer
Visual analytics tool for understanding large networks. Pending publication.
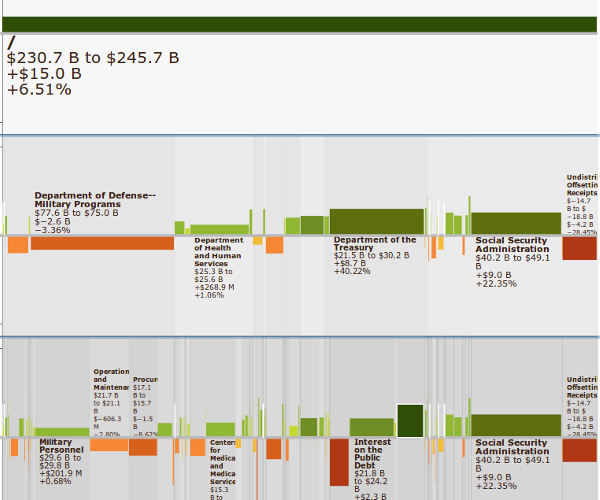
TreeVersity v2
Visualizing five dimensions of change in a dataset changing over time using hierarchies
TreeVersity v1
Comparing changes between trees on structure and node values.
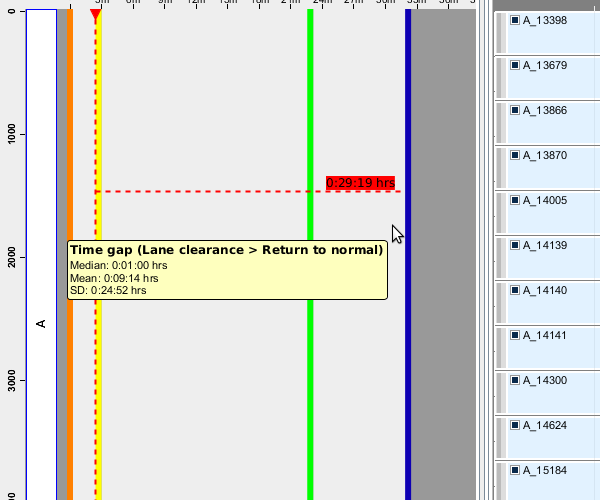
LifeFlow
A visual analytics tool for temporal categorical data. Helped developing the comparison modules as part of a broader project.
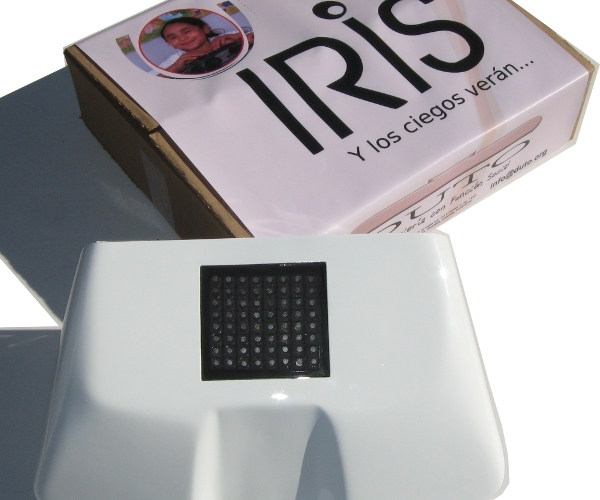
IRIS
A system to allow blind children to see colors and shapes with their hands